Technical Analysis


Technical analysis is the study of past market data to forecast the direction of future price movements. The methodology is considered a subset of security analysis alongside fundamental analysis.
In this tutorial, we look at how beginners can use technical analysis in day trading.
Quick Introduction
- Technical analysis is an approach to finding trading opportunities by assessing price patterns on charts.
- Traders believe studying historical market activity and price fluctuations can help identify future trends.
- It can be applied to a range of strategies and markets including day trading forex, crypto, oil and other commodities.
- Technical analysis is suitable for all experience levels from beginners to professionals.
Best Brokers for Technical Trading
For traders that want to start using technical analysis we recommend one of these brokers with great technical trading features:
-
1
 Interactive Brokers
 -
2
 NinjaTrader
 -
3
 eToro USAeToro USA LLC and eToro USA Securities Inc.; Investing involves risk, including loss of principal; Not a recommendation
 -
4
 Plus500USTrading in futures and options involves the risk of loss and is not suitable for everyone.
For advanced charting features, which make technical analysis easier to apply, we recommend the trading platform TradingView or broker eToro.
Download our free Technical Analysis PDF.
Technical Indicators
Technical Analysis Explained
Technical analysis refers to the range of charts, indicators and tools used to help investors spot future trading opportunities by evaluating historic market behavior and price action.
It contrasts with fundamental analysis, which can be applied both on a microeconomic and macroeconomic level. Micro-level fundamental analysis includes the study of revenues, costs, earnings, assets and liabilities, capital structure, and “soft” elements (quality of management team, competitive position).
Macro-level fundamental analysis entails the study or forecasting of economic growth, inflation, credit cycles, interest rate trends, capital flows between countries, labor and resource utilization and their cyclicality. It also includes demographic trends, central bank and political policies and behavior, geopolitical matters, consumer and business trends, and “soft” data (e.g. sentiment or confidence surveys).
Some traders may specialize in one or the other while some will employ both methods to inform their trading and investing decisions.
Most large banks and brokerages today have teams that specialize in both fundamental and technical analysis. In general, the more quality information one takes in to improve the odds of being right, the better one’s trading results are likely to be.
Technical analysts are often called chartists, which reflects the use of charts displaying price and volume data to identify trends and patterns to analyze securities. Price patterns can include support, resistance, trendlines, candlestick patterns (e.g. head and shoulders, reversals), moving averages, and technical indicators.
Assumptions in Technical Analysis
While some traders and investors use both fundamental and technical analysis, most tend to fall into one camp or another or at least rely on one far more heavily when making trading decisions.
Technical analysts rely on the methodology due to two main beliefs:
- Price history tends to be cyclical and
- Prices, volume, and volatility tend to run in distinct trends
Let’s take a look at both…
Market Cyclicality
Human nature tends to be cyclical i.e market history has a tendency to repeat itself. The sequence of events may not repeat itself perfectly, but the patterns are generally similar. These can take the form of long-term or short-term price behavior.
In the long-term, business cycles are inherently prone to repeating themselves, as driven by credit booms where debt rises unsustainably above income for a period and eventually results in financial pain when not enough cash is available to service these debts. This tends to result in slow progressive gains in stocks and other “risk-on” trades (e.g., carry trading) during an expansion and a sharp fall upon a recession.
Technicians believe that market participants are inclined to repeat the behavior of the past due to collective, patterned nature. If behavior is indeed repeatable, this implies that it can be recognized by looking at past price and volume data and used to predict future price patterns. Essentially if traders can locate opportunities where behavior is likely to be repeated, they can identify trades where the risk/reward runs in their favor.
Thus, there is the inbuilt assumption in technical analysis that a market’s price discounts all information influencing a particular market. While fundamental events impact financial markets, such as news and economic data, if this information is reflected in asset prices upon release, technical analysis will instead focus on identifying price trends and the extent to which market participants value certain information.
For example, if US CPI inflation data come in a tenth of a percentage higher than what was being priced into the market before the news release, we can back out how sensitive the market is to that information by watching how asset prices react immediately following.
If US stock futures move down X%, the US dollar index increases Y%, and the 10-year US Treasury yield increase Z%, we can get a feel for how such economic inputs impact certain markets. Knowing these sensitivities can be valuable for stress testing purposes as a form of risk management. For example, if inflation were to unexpectedly move up by 1%, we can use data points regarding surprise inflation readings to determine how the portfolio might be affected.
Best Brokers for Technical Analysis
-
1
Interactive Brokers
-
2
NinjaTrader
-
3
eToro USAeToro USA LLC and eToro USA Securities Inc.; Investing involves risk, including loss of principal; Not a recommendation
-
4
Plus500USTrading in futures and options involves the risk of loss and is not suitable for everyone.
Price, Volume, and Volatility Run in Distinct Trends
Another assumption behind technical analysis (and all securities analysis more broadly) is that price does not move according to a “random walk”, or according to no discernible or logical pattern. Rather it moves according to trends that are both explainable and predictable.
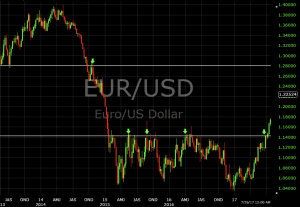
For example, if we look at a chart of the EUR/USD from mid-2013 to mid-2017, we can see how technical analysis played a role by looking at support and resistance within the context of the trend. After the euro began depreciating against the US dollar due to a divergence in monetary policy in mid-2014, technical analysts might have taken short trades on a pullback to resistance levels within the context of the downtrend (marked with arrows in the image below).
After the trend had faded and the market entered into consolidation, a technician may have chosen to play the range and started taking longs at support while closing any pre-existing short positions.
Characteristics
Originally, technical analysis was largely a matter of “reading the tape” or interpreting the successive flow and magnitude of price and volume data through a stock ticker. As computers became more widespread in the 1970s, data was compiled into chart form and became a technician’s standard point of reference.
Recognition of chart patterns and bar (or later candlestick) analysis were the most common forms of analysis, followed by regression analysis, moving averages, and price correlations. Today, the range of technical indicators is greater. Anyone with coding knowledge relevant to the software program can transform price or volume data into a particular indicator of interest.
Though technical analysis alone cannot wholly or accurately predict the future, it is useful to identify trends, behavioral proclivities, and potential mismatches in supply and demand to spot where trading opportunities could arise.
Analytical Approaches
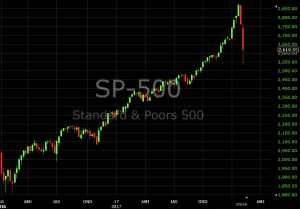
There are several ways to approach technical analysis. The simplest method is through a basic candlestick price chart, which shows price history and the buying and selling dynamics within a specified period.
Other investors employ a price chart along with technical indicators or use specialized forms of technical analysis, such as Elliott wave theory or harmonics, to generate trade ideas. Some use parts of several different methods. At the same time, traders must resist the idea of “information overload” or cluttering charts with so many indicators and lines that it begins to adversely impact one’s ability to read the chart.
Others may enter into trades only when certain rules uniformly apply to improve the objectivity of their trading and avoid emotional biases from impacting its effectiveness.
Types of Charts
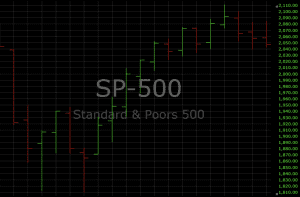
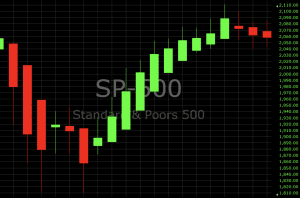
Candlestick
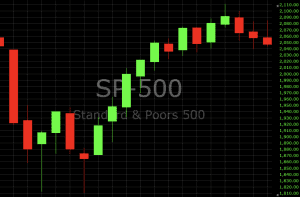
Candlestick charts are the most common form of charting in today’s software. Green (or sometimes white) is generally used to depict bullish candles, where the current price is higher than the opening price. Red (or sometimes black) is common for bearish candles, where the current price is below the opening price.
It essentially shows the distance between opening and closing prices (the body of the candle) and the total daily range (from top of the wick to bottom of the wick).
Open-High Low-Close
A candlestick chart is similar to an open-high low-close chart, also known as a bar chart. But instead the difference between the open and close price are represented by horizontal tick marks. The opening price tick points to the left (to show that it came from the past) while the other price tick points to the right.
Candlestick charts are particularly popular with beginner traders starting out with technical analysis.
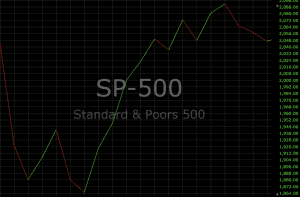
Line
A line chart connects data points using a line, usually from the closing price of each time period.
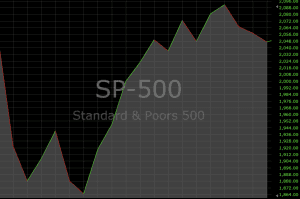
Area
An area chart is essentially the same as a line chart, with the area under it shaded. This is done to visualize the price movement relative to a line chart.
Heiken-Ashi
Heiken-Ashi charts use candlesticks as the plotting medium, but take a different mathematical formulation of price. Instead of the standard procedure of candles translated from basic open-high low-close criteria, prices are smoothed to better indicate trending price action according to this formula:
- Open = (Open of previous bar + Close of previous bar) / 2
- Close = (Open + High + Low + Close) / 4
- High = Highest of High, Open, or Close
- Low = Lowest of Low, Open, or Close
Trading charts can analyse a range of time periods depending on objectives, from 1 minute to 1 hour or even 8 hour charts. The 8 hour time frame is particularly popular amongst forex traders.
Common Terms
Important technical analysis terminology to get your head around includes:
- Average true range – The range over a certain time period, usually daily
- Breakout – When price breaches an area of support or resistance, often due to a notable surge in buying or selling volume.
- Cycle – Periods where price action is expected to follow a certain pattern
- Dead cat bounce – When price declines in a down market, there may be an uptick in price where buyers come in believing the asset is cheap or selling overdone. However, when sellers force the market down further, the temporary buying spell comes to be known as a dead cat bounce
- Dow theory – Studies the relationship between the Dow Jones Industrial Average (an index comprised of 30 US multinational conglomerates) and Dow Jones Transportation Average. Proponents of the theory state that once one of them trends in a certain direction, the other is likely to follow. Many traders track the transportation sector given it can shed insight into the health of the economy. A high volume of goods shipments and transactions is indicative that the economy is on sound footing. A similar indicator is the Baltic Dry Index
- Doji – A candle type characterized by little or no change between the open and close price, showing indecision in the market
- Elliott wave theory – Elliott wave theory suggests that markets run through cyclical periods of optimism and pessimism that can be predicted and thus ripe for trading opportunities
- Fibonacci ratios – Numbers used as a guide to determine support and resistance
- Harmonics – Harmonic trading is based on the idea that price patterns repeat themselves and turning points in the market can be identified through Fibonacci sequences
- Momentum – The rate of change of price with respect to time
- Price action – The movement of price, as graphically represented through a chart of a particular market
- Resistance – A price level where a preponderance of sell orders may be located, causing price to bounce off the level downward. Sufficient buying activity, usually from increased volume, is often necessary to breach it
- Retracement – A reversal in the direction of the prevailing trend, expected to be temporary, often to a level of support or resistance
- Support – A price level where a higher magnitude of buy orders may be placed, causing price to bounce off the level upward. The level will not hold if there is sufficient selling activity outweighing buying activity
- Trend – Price movement that persists in one direction for an elongated period of time
The Best Technical Analysis Indicators for Day Trading
Indicators involve some statistical or arithmetical transformation of price and/or volume data to provide mathematical descriptions of up/down movement, support and resistance levels, momentum, trend, deviations from a central tendency, ratio(s), correlation(s), among other delineations. Some indicators also describe sentiment, such as short interest, implied volatility, put/call ratios, “fear” or “greed”, and so forth.
Technical indicators fall into a few main categories, including price-based, volume-based, breadth, overlays, and non-chart based.
Price-Based
- Average Directional Index (ADX) – Measures trend strength on an absolute value basis
- Average Directional Movement Rating (ADXR) – Measures the rate of change in a trend
- Commodity Channel Index (CCI) – Identifies new trends or cyclical conditions
- Coppock Curve – Momentum indicator, initially intended to identify bottoms in stock indices as part of a long-term trading approach
- MACD – Plots the relationship between two separate moving averages; designed as a momentum-following indicator
- Momentum – The rate of change in price
- Moving Average – A weighted average of prices to indicate the trend over a series of values
- Relative Strength Index (RSI) – Momentum oscillator standardized to a 0-100 scale designed to determine the rate of change over a specified time period
- Stochastic Oscillator – Shows the current price of the security or index relative to the high and low prices from a user-defined range. Used to determine overbought and oversold market conditions
- Trix – Combines to show trend and momentum
- KDJ – is used in trading to analyse price changes in stock trends and price patterns in a traded asset. It is also known as the random index. It is very practical meaning it is widely used across short-term stock trading
Volume-based
Other key indicators used for technical analysis include:
- Money Flow Index – Measures the flow of money into and out of a stock over a specified period
- Negative Volume Index – Designed to understand when the “smart money” is active, under the assumption that the smart money is most active on low-volume days and not as active on high-volume days. Indicator focuses on the daily level when volume is down from the previous day
- On-Balance Volume – Uses volume to predict subsequent changes in price. Proponents of the indicator place credence into the idea that if volume changes with a weak reaction in the stock, the price move is likely to follow
- Positive Volume Index – Typically used alongside the negative volume index, the indicator is designed to show when institutional investors are most active under the premise they’re most likely to buy or sell when volume is low. Focuses on days when volume is up from the previous day
- Williams Accumulation/Distribution – Looks at divergences between security (or index) price and volume flow. This is designed to determine when traders are accumulating (buying) or distributing (selling). For example, when price makes a new low and the indicator fails to also make a new low, this might be taken as an indication that accumulation (buying) is occurring.
Breadth
Breadth technical analysis indicators determine how strong or shallow a market move is:
Advance-Decline Line – Measures how many stocks advanced in an index versus the number of stocks that declined. If an index has gained in value but only 30% of the stocks are up but 70% are down or neutral, that’s an indication that the buying is likely only occurring in certain sectors rather than being positive toward the entire market.
If 98% of the stocks are up but only 2% are down or neutral at the open of the market, it’s an indication that the market might be more trendless and “reversion to the mean” day trading strategies could be more effective. However, if a lopsided advance/decline persists, it could mean that the market could be trending.
Arms Index (aka TRIN) – Combines the number of stocks advancing or declining with their volume according to the formula:
(# of advancing stocks / # of declining stocks) / (volume of advancing stocks / volume of declining stocks)
A value below 1 is considered bullish; a value above 1 is considered bearish. Volume is measured in the number of shares traded and not the dollar amounts, which is a central flaw in the indicator (favors lower price-per-share stocks, which can trade in higher volume). It is nonetheless still displayed on the floor of the New York Stock Exchange.
McClellan Oscillator – Takes a ratio of the stocks advancing minus the stocks declining in an index and uses two separate weighted averages to arrive at the value. It is best used when price and the oscillator are diverging. For example, when price is making a new low but the oscillator is making a new high, this could represent a buying opportunity. Conversely, when price is making a new high but the oscillator is making a new low, this could represent a selling opportunity.
Overlays
Overlay technical analysis indicators are placed over the original price chart.
- Bollinger Bands – Uses a simple moving average and plots two lines two standard deviations above and below it to form a range. Often used by traders using a mean reversion strategy where price moving above or below the bands is “stretched” and potentially expected to revert back inside the bands
- Channel – Two parallel trend lines set to visualize a consolidation pattern of a particular direction. A breakout above or below a channel may be interpreted as a sign of a new trend and a potential trading opportunity
- Fibonacci Lines – A tool for support and resistance generally created by plotting the indicator from the high and low of a recent trend
- Ichimoku Cloud – Designed to be an “all-in-one” indicator that gives support and resistance, momentum, trend, and generates trading signals
- Moving Average – A trend line that changes based on new price inputs. For example, a 50-day simple moving average would represent the average price of the past 50 trading days. Exponential moving averages weight the line more heavily toward recent prices
- Parabolic SAR – Intended to find short-term reversal patterns in the market. Generally only recommended for trending markets
- Pivot Points – Levels of support and resistance determined from yesterday’s open, high, low and close. Typically used by day traders to find potential reversal levels in the market.
- Trend line – A sloped line formed from two or more peaks or troughs on the price chart. A break above or below a trend line might be indicative of a breakout
Non-Chart Based
Not all technical analysis is based on charting or arithmetical transformations of price. Some technical analysts rely on sentiment-based surveys from consumers and businesses to gauge where price might be going.
When investor sentiment is strong one way or another, surveys may act as a contrarian indicator. If the market is extremely bullish, this might be taken as a sign that almost everyone is fully invested and few buyers remain on the sidelines to push prices up further. This might suggest that prices are more inclined to trend down. Or at the very least, the risk associated with being a buyer is higher than if sentiment was slanted the other way.
Final Word On Technical Analysis
From day trading stocks on the FTSE 100 to crypto, oil and forex, technical analysis is widely used in many a strategy. Technical analysis refers to the range of tools used to help traders spot future opportunities by evaluating previous behaviors. Whilst approaches may vary, most traders will agree that using technical analysis in some form or other, is mastery for daily profit.
If you are looking to learn more about day trading using technical analysis, the best brokers will offer educational resources and services, usually in a variety of formats including books, pdfs, courses, diplomas and tutorials. There are some day trading brokers without resources for technical analysis but plenty that do offer a good range so be sure to do your research. See our list of top platforms to start trading today.
FAQs
Who Should Be Using Technical Analysis?
Technical analysis is useful for all traders. Whether you have been trading for 5 minutes or 5 years, technical analysis offers useful insights to guide traders of all experience levels, across markets and asset classes.
Do Day Traders Use Technical Analysis?
Yes, most successful day traders will utilize some form of technical analysis in their strategies. Approaches may vary according to objectives and market conditions.
How Do I Learn Technical Analysis For Day Trading?
If you read the guide above, congratulations, you have already started! The next step is to find a broker that offers the technical analysis tools you intend to use. This step is key, do your research and make use of demo accounts where available.
What Are Candlestick Charts Used For In Technical Analysis?
Candlestick charts are used by traders to determine future price movements based on past behaviour. They can be applied to many markets and are available on most popular trading platforms.
Does Technical Analysis Work For Day Trading Stocks?
Technical analysis can work for day trading stocks. It can be used across assets classes from stocks and forex to cryptos and commodities. It can also be used for long-term and short-term and trading strategies.