Trading With VWAP and Moving VWAP


Volume weighted average price (VWAP) and moving volume weighted average price (moving VWAP, or sometimes MVWAP) are a type of weighted average that include volume in their calculations. It is plotted directly on a price chart.
The Best Brokers For Trading With VWAP & Moving VWAP
-
1
 Interactive Brokers
 -
2
 NinjaTrader
 -
3
 eToro USAeToro USA LLC and eToro USA Securities Inc.; Investing involves risk, including loss of principal; Not a recommendation
 -
4
 Plus500USTrading in futures and options involves the risk of loss and is not suitable for everyone.
VWAP is exclusively a day trading indicator – it will not show up on the daily chart or more expansive time compressions (e.g., weekly, monthly).
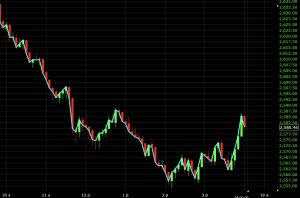
Example of VWAP applied to a 5-minute chart of the S&P 500
Price hovering below VWAP may indicate that a security is “cheap” or “of value” on an intraday basis. Contrarily, price above VWAP may indicate that a security is “expensive” on an intraday basis.
VWAP is also used as a barometer for trade fills. Volume is an important component related to the liquidity of a market. For example, if a long trade is filled above the VWAP line, this might be considered a non-optimal trade fill.
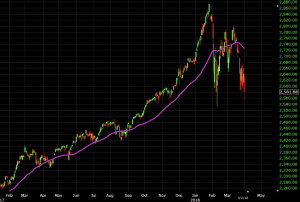
Moving VWAP tracks end-of-day VWAP calculations over time, and thus essentially forms a moving average. Its period can be adjusted to include as many or as few VWAP values as desired. Below is an image of the moving VWAP applied to a daily chart of the S&P 500 (pink line).
It should be noted that VWAP and moving VWAP may not work on currencies/forex due to the fact that many software platforms do not account for volume data in this asset class.
Calculating VWAP
VWAP is calculated through the following steps:
1. For each period, calculate the typical price, which is equal to the sum of the high, low, and close price divided by three [(H+L+C)/3]. One bar or candlestick is equal to one period. What this period is set at is up to the trader’s discretion (e.g., 5-minute, 30-minute, etc.).
2. Take the typical price (TP) and multiply by the volume (V), giving a value TP*V.
3. Keep a running tabulation of the TP*V totals as well as a running tally of volume totals. These are additive and aggregate over the course of the day.
4. VWAP is calculated by the formula: cumulative TP*V / cumulative volume
This calculation, when run on every period, will produce a volume weighted average price for each data point. This information will be overlaid on the price chart and form a line, similar to the first image in this article.
Moving VWAP is simply adding up various end-of-day VWAP figures and averaging them out over a user-specified number of periods.
VWAP will be calculated automatically in one’s charting software. There should be no mathematical or numerical variables that need adjustment. On the moving VWAP indicator, one will need to set the desired number of periods.
Uses of VWAP and Moving VWAP
VWAP, being an intraday indicator, is best for short-term traders who take trades usually lasting just minutes to hours.
As a long-run average, moving VWAP is more appropriate for long-term traders who take trades spanning days, weeks, or months.
Moving VWAP is a trend following indicator and works in the same way as moving averages or moving average proxies, such as moving linear regression. For those who use trend following as the bedrock of their trading strategies, moving VWAP could be a viable indicator to integrate into one’s system.
Price reversal traders can also use moving VWAP. In such cases, it’s recommended that one use a crossover strategy. The basic idea in crossover strategies is to use a “fast” average to gauge trend direction when it crosses over a “slow” average.
To find price reversals in timely fashion, it is recommended to use shorter periods for these averages. For example, your “fast” moving VWAP line could be set to 1-3 periods while the slow moving VWAP line could be set at around 5-10 periods.
This ensures that price reacts fast enough to diagnose shifts in the trend early before the bulk of the move already passes and leaves a non-optimal entry point. How to approach this will be covered in the section below.
Trading Examples
As mentioned above, there are two basic ways to approach trading with VWAP – either trend trading or price reversals. We’ll start with trend trading to start.
Trend Following Trading Examples
Like any indicator, using it as the sole basis for trading is not recommended. One cannot simply follow the slope of a moving average type of indicator and expect to slant the odds sufficiently in one’s favor. Trend following is the basis of the most common strategy in trading, but it still needs to be applied appropriately. This can mean taking cues from price action, chart patterns, other technical indicators, and/or fundamental analysis.
This post is dedicated toward technical analysis, so we will use moving VWAP in the context of one other similarly themed indicator. We’ll be using the derivative oscillator, which runs between bullish periods and bearish periods when it is above and below zero, respectively.
Our trade rules will be simple:
Long Trades
- Moving VWAP needs to be positively sloped
- Derivative oscillator above zero
Short Trades
- Moving VWAP needs to be negatively sloped
- Derivative oscillator below zero
Trade Exits
- Either one of these two criteria invalidated
Example #1
Let’s take a look at an example using moving VWAP on the daily timeframe of the S&P 500.
Since the moving VWAP line is positively sloped throughout, we are biased toward long trades only. These come when the derivative oscillator comes above zero, and are closed out when it runs below zero. The trades are marked off by the “Buy” zones between the vertical white lines.
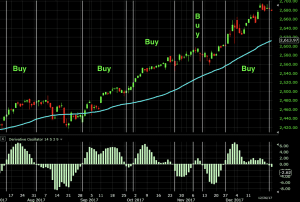
This produced four decent sized winners and one small loser.
Example #2
Here we apply this basic system to an ETF that tracks the coffee futures market (ticker symbol NYSEARCA:JO).
We have one long trade and four short trades.
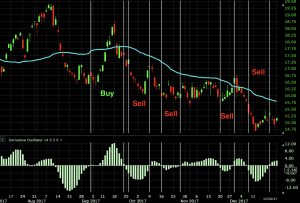
This has a more mixed performance, producing one winner, one loser, and three that roughly broke even.
Price Reversal Trading Examples
Price reversal trades will be completed using a moving VWAP crossover strategy. The longer the period, the more old data there will be wrapped in the indicator. We want to minimize this in order to catch reversals as early as possible, so we want to shorten the period.
We want the periods to be short, but not so short that we end up with something that’s very choppy and sends out several false or ambiguous signals. In the case of moving VWAP, we can lower the period of the “fast” line all the way down to 1, if necessary. Our “slow” line can be as short as 5 periods.
To obtain an indication of when price may be becoming stretched, we can pair it with another price reversal indicator, such as the envelope channel. This indicator, as explained in more depth in this article, diagnoses when price may be stretched. To keep the signals as accurate as possible, we’ll use a tighter period (10) and use a standard deviation of 5. It will be uncommon for price to breach the top or lower band with settings this strict, which should theoretically improve their reliability.
So to lay out our rules for this system:
Long Trades
- Fast (1-period) line crosses above slow (5-period) line
- Recent touch of the bottom band
Short Trades
- Fast line crosses below slow line
- Recent touch of the top band
Trade Exits
- Subsequent crossover of the moving VWAP lines to disconfirm previous trend
Example
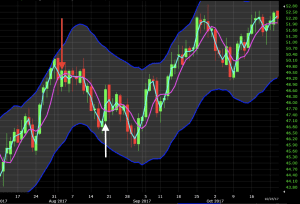
Let’s apply this to the daily chart of the crude oil market.
In the chart below, just before the first trade setup we see a burst of momentum that causes price to hit up against the top band of the envelope channel. Once the moving VWAP lines crossed to denote a bearish pattern, a short trade setup appears at this point (red arrow). This takes us down some 2%-3% before the “fast” moving VWAP line crosses back over to disconfirm the trend. This leads to a trade exit (white arrow).
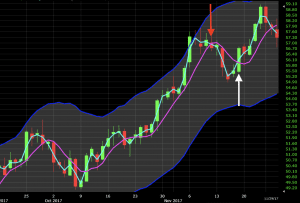
Later we see the same situation. Price moves up and runs through the top band of the envelope channel. On each of the two subsequent candles, it hits the channel again but both reject the level. Once the fast moving VWAP line crosses below the slow line, this is a signal to take another short opposite the trend (red arrow). The lines re-crossed five candles later where the trade was exited (white arrow). If trades are opened and closed on the open and close of each candle this trade would have roughly broken even.
Trading VWAP
VWAP is calculated intraday only and is mainly used in the markets to check the quality of a price fill or whether a security is a good value based on the daily timeframe. If price is below VWAP, it may be considered a good price to buy. When price is above VWAP it may be considered a good price to sell.
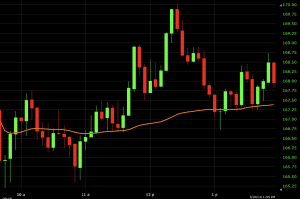
If we look at this example of a 5-minute chart on Apple (AAPL), price being below VWAP indicates that Apple could be reasonable value (or a long trade at one of these prices being a quality fill).
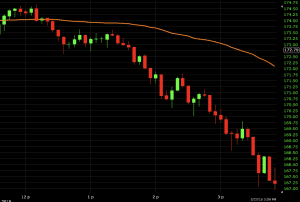
Likewise, as price runs above VWAP, it could inform a trader that Apple is expensive on an intraday basis. If he or she plans to go long/buy the stock with the plan of holding it on a short-term basis only, it might be best to wait.
Obviously, VWAP is not an intraday indicator that should be traded on its own. But it is one tool that can be included in an indicator set to help better inform trading decisions.
Conclusion
VWAP is calculated throughout the trading day and can be useful to determine whether an asset is cheap or expensive on an intraday basis. Traders might check VWAP at the end of day to determine the quality of their execution if they took a position on that particular security. If their fill price was below VWAP, this would be considered a plus (if the trade is a buy/long position). If price is above the VWAP, this would be considered a negative.
VWAP starts anew each trading day.
Moving VWAP is a trend following indicator. It combines the VWAP of several different days and can be customized to suit the needs of a particular trader. Longer-period moving VWAP’s are generally used by long-term traders to track multi-month or multi-year trends. It can smooth out “noise” in a market for traders who are more concerned about the longer-term trends or cyclicality that may exist in certain markets rather than focusing on day-to-day movement.
Price reversal traders might use crossover of moving VWAP’s to pinpoint turning points in a market. Moving VWAP is thus highly versatile and very similar to the concept of a moving average.