Best Day Trading Indicators For Beginners


Technical indicators are indispensable tools for day traders, offering insightful signals derived from historical price action to help you make informed and timely decisions.
In this guide, we list the best day trading indicators and explain how to use them to improve your trading performance.
Quick Introduction
- Trading indicators are mathematical calculations based on historical price, volume, or open interest data, and are designed to help you analyze and forecast future price movements.
- These tools can help you make informed decisions by providing visual representations or numerical outputs that highlight potential trends, momentum, volatility, and other aspects of market behavior.
- Confirming signals across different indicators can provide stronger validation for a trade, reducing the risk of false alarms and improving reliability.
- While day trading indicators offer valuable insights, they are not foolproof, so make sure you implement risk management to protect your capital.
Best Brokers for Day Trading Indicators
Our tests show that these 4 platforms offer an excellent suite of technical indicators for day trading:
-
1
 Interactive Brokers
 -
2
 NinjaTrader
 -
3
 eToro USAeToro USA LLC and eToro USA Securities Inc.; Investing involves risk, including loss of principal; Not a recommendation
 -
4
 Plus500USTrading in futures and options involves the risk of loss and is not suitable for everyone.
Download our free Day Trading Indicators PDF.
Prefer learning visually? Watch our video guide to day trading indicators:
How To Use Technical Indicators For Day Trading
Indicators can be valuable tools for day trading, offering insights into price trends, momentum, and potential reversals.
However, their effectiveness is contingent on factors such as time sensitivity, confirmation with price action, and adaptability to changing market conditions.
Day trading requires working with short timeframes, so you need to choose indicators that align with your preferred trading intervals.
While indicators provide valuable information, you should confirm their signals with price action analysis, combining technical indicators with chart patterns, support/resistance levels, and candlestick formations.
Overloading charts with too many indicators can lead to confusion and conflicting signals, so it’s advisable when day trading to select a few key indicators that complement each other.
Additionally, market conditions during a day trading session can change rapidly, emphasizing the importance of adaptability and the need to adjust your strategy accordingly.
I recommend learning the underlying principles and calculations behind the day trading indicators you use. This knowledge will empower you to interpret signals more accurately and make you less reliant on default settings.
We’ve broken down our top 10 indicators for day trading further below. Alternatively, see our full list for a deep dive into specific indicators…
Technical Indicators
10 Best Indicators For Day Trading
1. Volume
The volume indicator measures the number of shares or contracts traded within a specific period. It is an excellent tool for technical analysts as it provides insights into the strength and sustainability of price movements.
Volume can be observed in various forms, including volume bars on price charts or as a separate indicator.
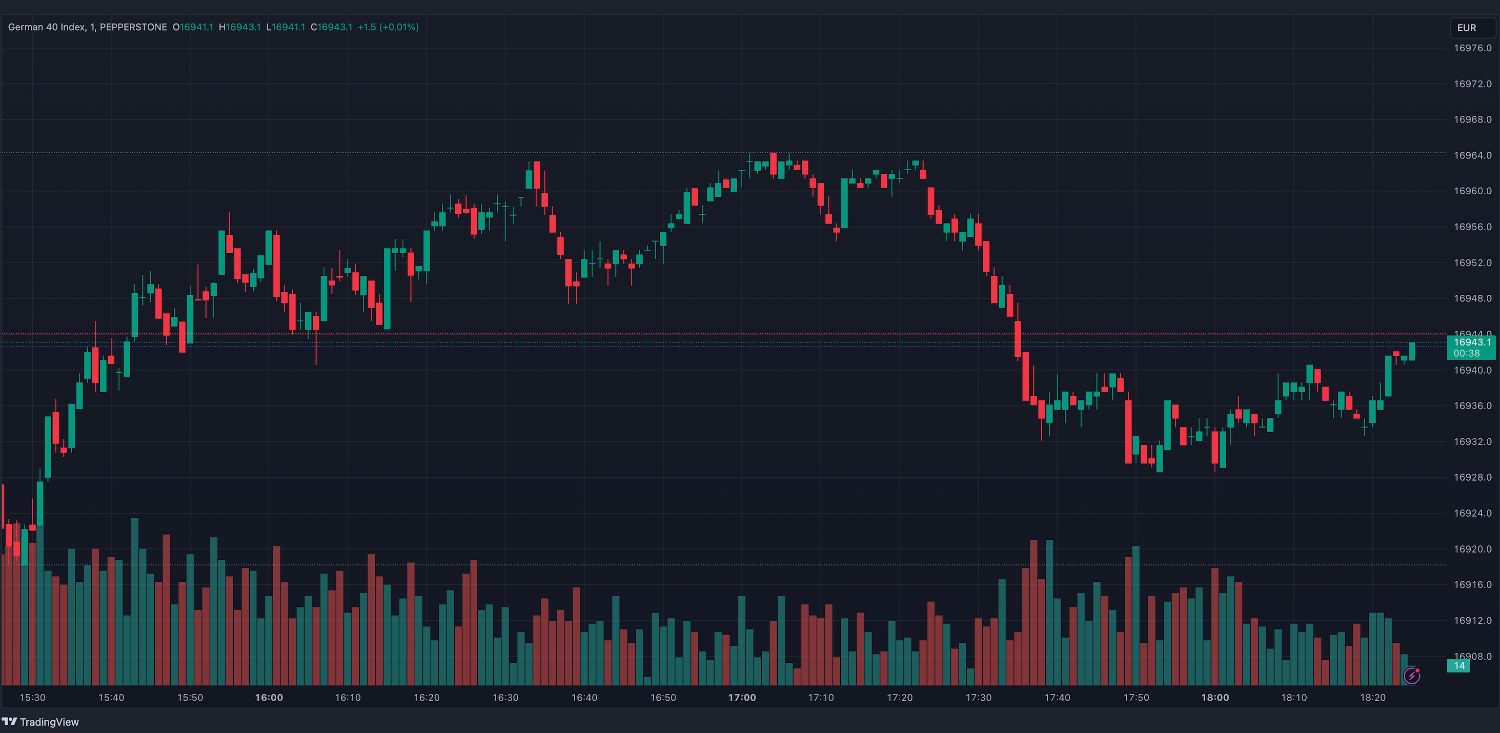
For day trading, the volume indicator can be effectively used in the following ways:
Confirmation Of Price Movements
Volume is often used to confirm the strength of price movements. An increase in volume during an uptrend suggests strong buying interest, confirming the upward movement. Conversely, increased volume during a downtrend confirms strong selling interest.
Breakout Confirmation
You can use volume to confirm the validity of breakouts from key levels. A breakout accompanied by high volume is considered more reliable, signaling potential sustained momentum in the direction of the breakout.
Divergence Analysis
Divergence between price and volume can provide valuable signals. For example, if the price is making new highs, but volume is decreasing, it may indicate weakening buying interest, potentially signaling a reversal.
Identifying Reversals
Volume can be useful in identifying potential reversal points. A sharp increase in volume near a price reversal often indicates a strong shift in sentiment, suggesting the possibility of a trend reversal.
Gap Analysis
Volume is particularly important in analyzing price gaps. For instance, a gap up with high volume may suggest strong buying interest, while a gap down with high volume may indicate strong selling pressure.
Churn & Accumulation
Monitoring volume can help you identify periods of accumulation or distribution by institutional investors. Unusually high volume without significant price movement may indicate accumulation or distribution.
2. Exponential Moving Average (EMA)
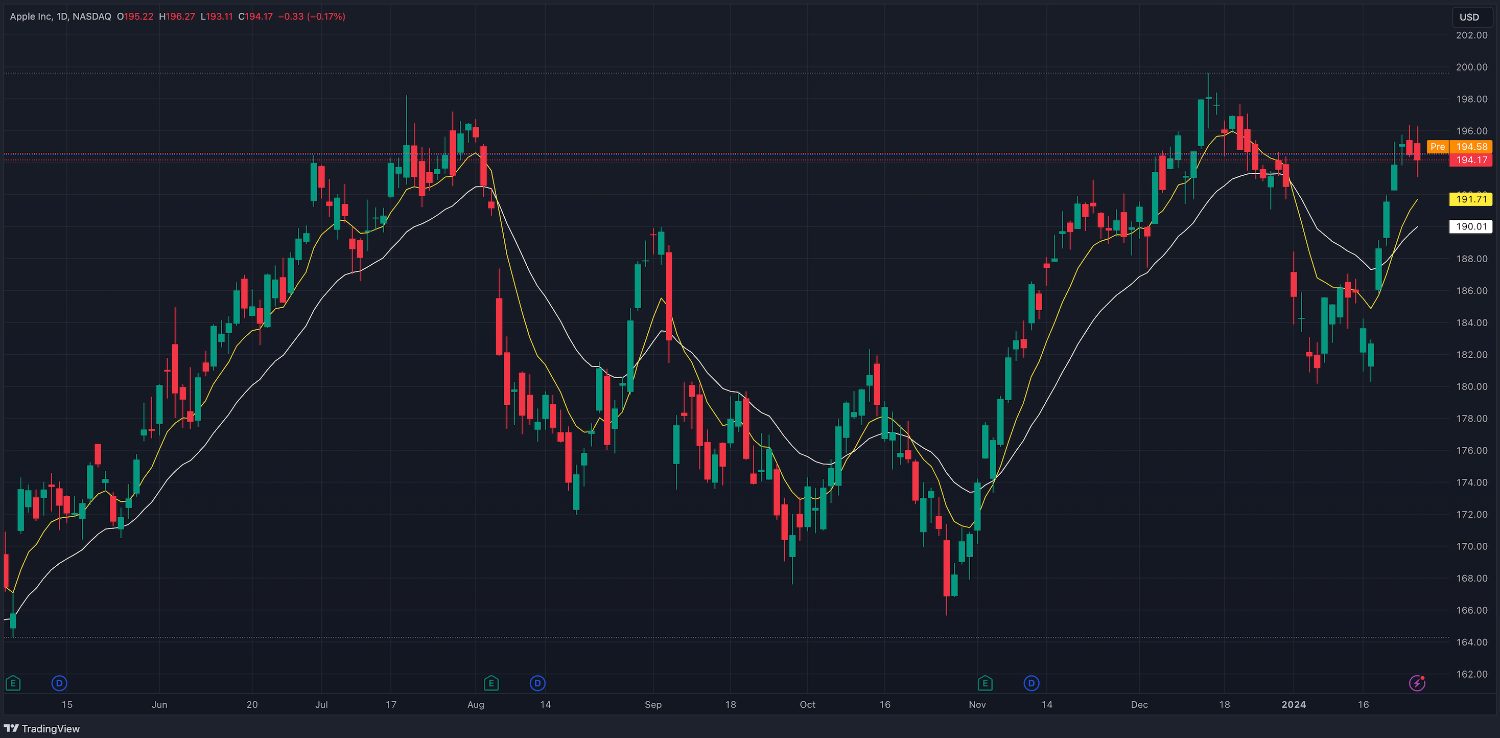
The Exponential Moving Average (EMA) is a type of moving average that gives more weight to recent price data, making it more responsive to changes compared to a simple moving average.
Unlike other types of Moving Averages (MAs) that have a single set period (e.g., 20 periods), the Exponential Moving Average (EMA) employs two distinct time intervals to calculate its value.
In an EMA configuration like 50/100, the initial point used in the calculation will be 50 periods back from the current price, combined with the data from 100 periods prior.
It is calculated by assigning greater significance to the most recent prices, thereby reflecting current market conditions more accurately.
For day trading, the EMA can be particularly useful in the following ways:
Trend Identification
EMAs are effective in identifying short-term trends to capitalize on intraday price movements. A rising EMA suggests an uptrend, while a declining EMA indicates a downtrend.
Entry & Exit Signals
EMA crossovers can be used to generate signals for entering or exiting trades. For instance, a bullish crossover (when a shorter-term EMA crosses above a longer-term EMA) may signal a potential buying opportunity, while a bearish crossover could indicate a potential selling opportunity.
Support & Resistance Levels
EMAs can act as dynamic support or resistance levels. Observing how the price interacts with the EMA lets you gauge potential reversal points or trend continuation.
Price Momentum
The slope of the EMA provides insights into the momentum of price movements. Steeper slopes indicate stronger momentum, while flatter slopes suggest weakening momentum.
Risk Management
EMAs can aid in setting dynamic stop-loss levels. You can use the EMA as a reference point to adjust stop-loss orders based on the prevailing trend, helping manage risk effectively.
3. Moving Average Convergence Divergence (MACD)
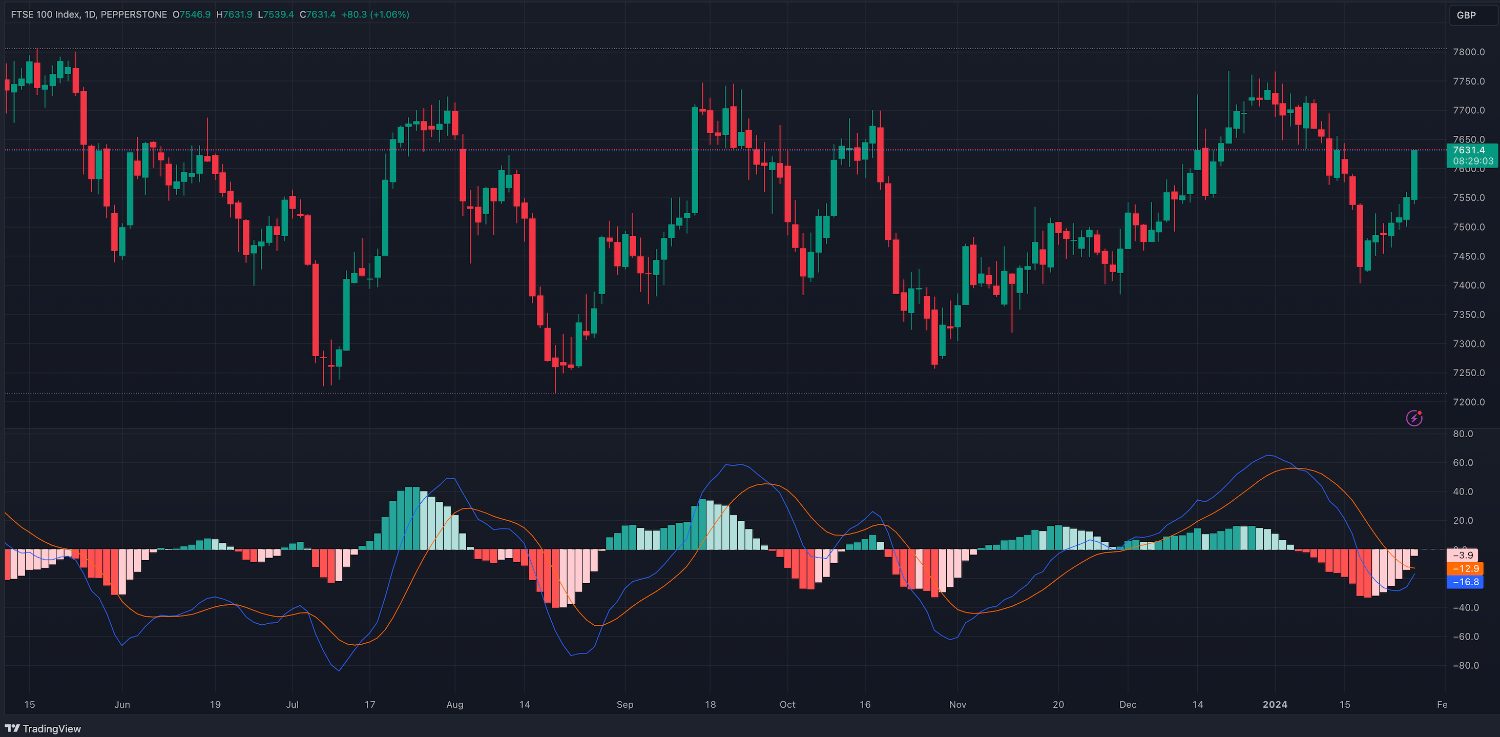
The Moving Average Convergence Divergence (MACD) is a momentum indicator used to identify potential trend reversals, momentum shifts, and the strength of a trend.
It is calculated by subtracting the 26-period Exponential Moving Average (EMA) from the 12-period EMA, and a 9-period Signal Line (EMA of the MACD line) is plotted to generate trading signals.
For day trading, the MACD can be effectively utilized in several ways:
Crossover Signals
MACD crossovers can be used to generate buy or sell signals. A bullish crossover (MACD line crossing above the Signal Line) may signal a potential buying opportunity, while a bearish crossover (MACD line crossing below the Signal Line) could indicate a potential selling opportunity.
Divergence Analysis
Divergences between the MACD and price chart can help you identify potential reversals. Bullish divergence occurs when the price makes lower lows, but the MACD makes higher lows, suggesting potential upward momentum. Conversely, bearish divergence may signal potential downward momentum.
Histogram Analysis
The MACD histogram represents the difference between the MACD line and the Signal Line. The height and direction of the histogram bars can be used to gauge changes in momentum. Rising bars indicate increasing momentum, while falling bars suggest weakening momentum.
4. Relative Strength Index (RSI)
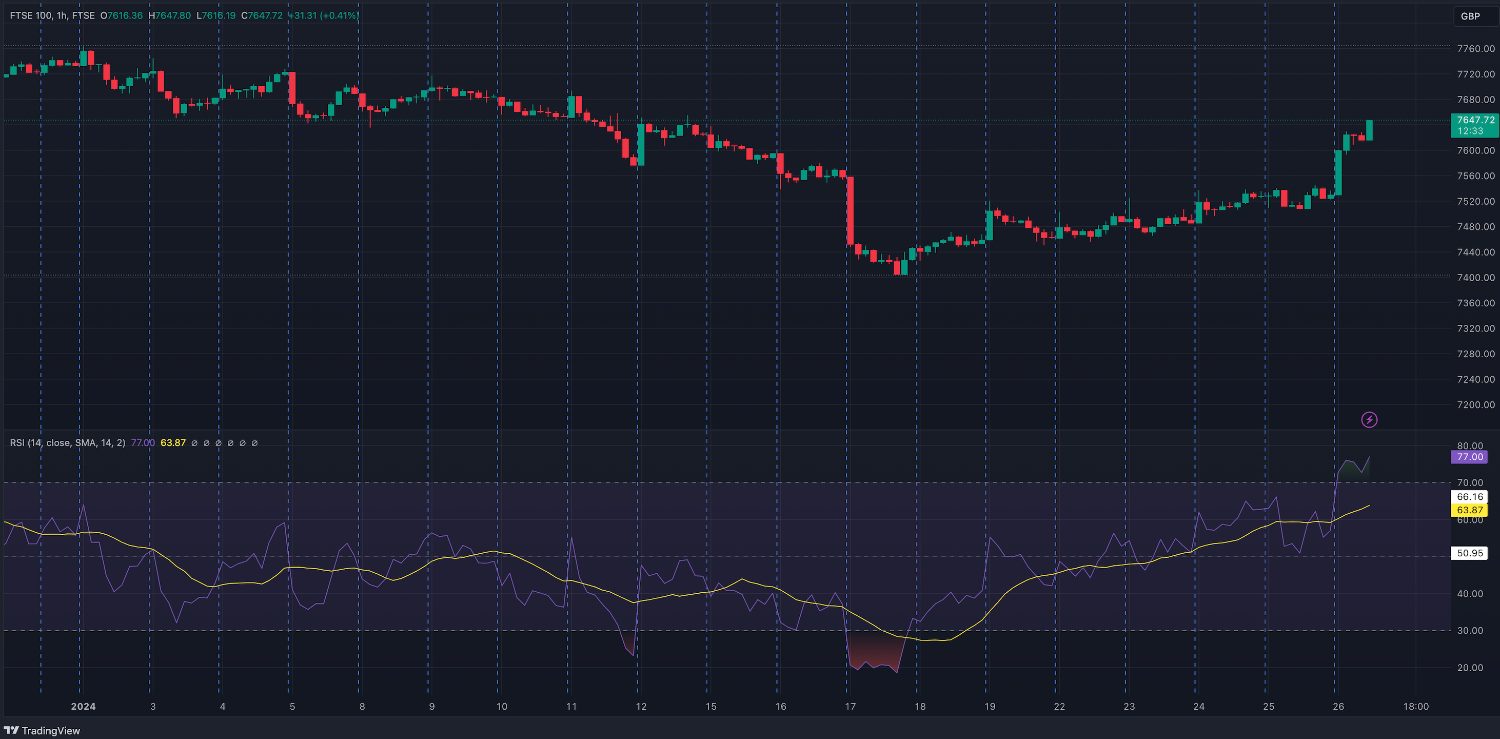
The Relative Strength Index (RSI) is a momentum oscillator that measures the speed and change of price movements. It is commonly used to identify overbought or oversold conditions in a market.
The RSI is calculated based on the average gains and losses over a specified period, typically 14 periods.
For day trading, the RSI can be effectively used in the following ways:
Overbought & Oversold Levels
The RSI is scaled from 0 to 100. Traditionally, an RSI reading above 70 is considered overbought, suggesting that the asset may be due for a potential reversal or pullback. Conversely, an RSI below 30 is considered oversold, indicating that the asset may be due for a potential upward reversal.
Divergence Analysis
Similar to other oscillators, you can look for divergences between the RSI and price movements. Bullish divergence occurs when the price makes lower lows, but the RSI makes higher lows, suggesting potential upward momentum. Bearish divergence occurs when the price makes higher highs, but the RSI makes lower highs, indicating potential downward momentum.
Trend Confirmation
The RSI can help confirm the strength of a trend. In a strong uptrend, the RSI tends to stay in the overbought zone for extended periods, while in a strong downtrend, the RSI tends to stay in the oversold zone for extended periods.
This information can be valuable for trend-following strategies.
Centerline Crosses
The RSI’s centerline, usually set at 50, can be used to identify the overall trend direction. Readings above 50 may indicate bullish momentum, while readings below 50 may suggest bearish momentum.
Signal Confirmation
Combining RSI signals with other technical indicators or chart patterns can help confirm potential trading opportunities.
For example, using RSI signals in conjunction with trendlines or support/resistance levels can enhance the reliability of signals.
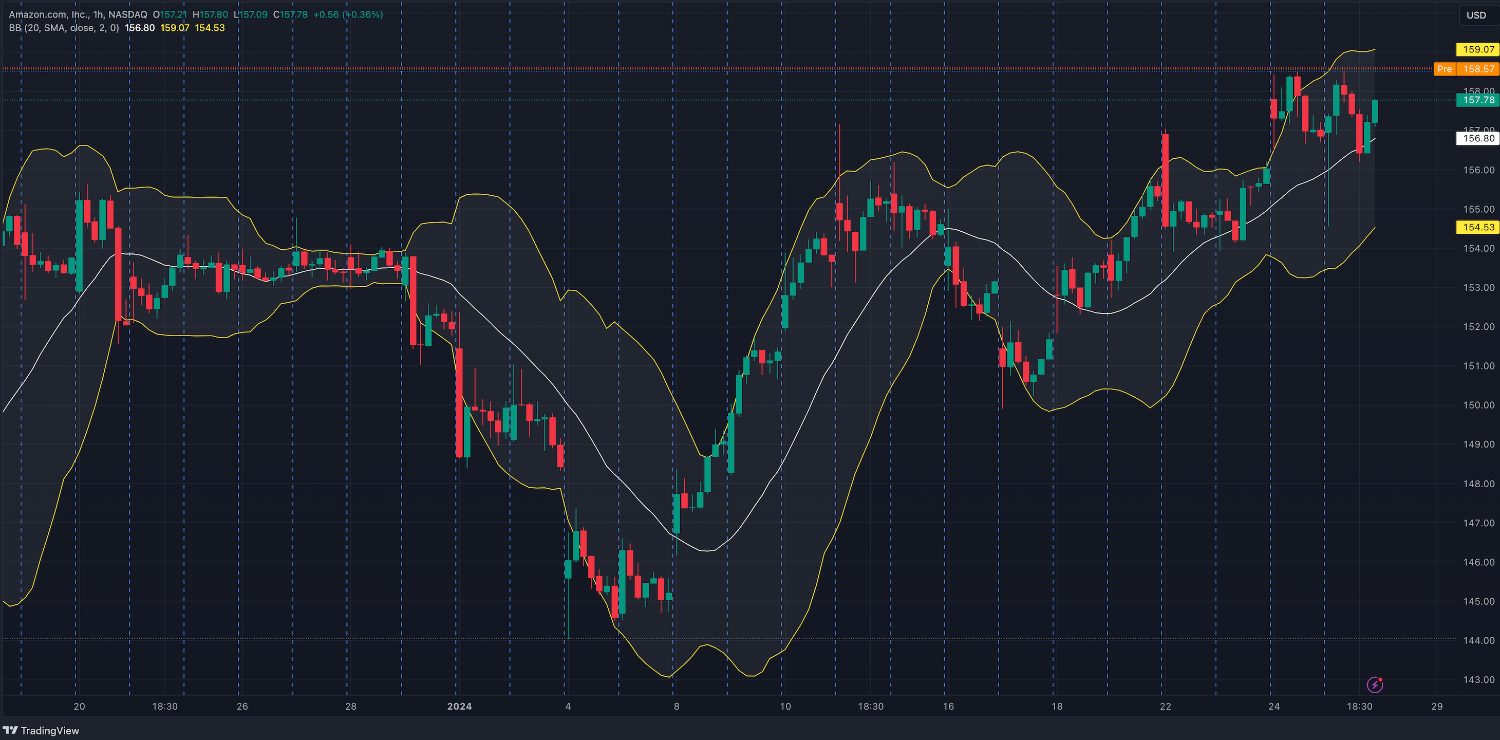
5. Bollinger Bands
Bollinger Bands are a momentum indicator that consist of a middle band, which is typically a simple moving average (SMA), and two outer bands that are standard deviations away from the middle band. The standard settings use a 20-period SMA and two standard deviations for the bands.
The purpose of Bollinger Bands is to provide a relative definition of high and low prices, identify potential trend reversals, and highlight volatility.
For day trading, Bollinger Bands can be used in the following ways:
Volatility Measurement
Bollinger Bands expand and contract based on market volatility. Wider bands indicate higher volatility, while narrower bands suggest lower volatility. You can use the width of the bands to gauge the current market conditions and adjust your strategy accordingly.
Overbought & Oversold
Similar to the RSI, Bollinger Bands can be used to identify overbought and oversold conditions. When the price touches or crosses the upper band, it may suggest overbought conditions, indicating a potential reversal or pullback. Conversely, when the price touches or crosses the lower band, it may suggest oversold conditions, signaling a potential upward reversal.
Trend Reversals
Reversals can be identified when the price moves beyond one of the bands. For example, if the price moves above the upper band, it may indicate a potential reversal to the downside, and if it moves below the lower band, it may suggest a potential reversal to the upside.
Squeeze Patterns
Bollinger Bands can help identify periods of low volatility, known as squeezes. Squeezes often precede significant price movements. You can look for a period of contraction in the bands and anticipate a potential breakout when volatility expands again.
Moving Average Crossovers
The interaction between the price and the middle band (SMA) can be used as a signal for potential trend changes. For instance, if the price crosses above the middle band, it may suggest a bullish trend, and if it crosses below, it may suggest a bearish trend.
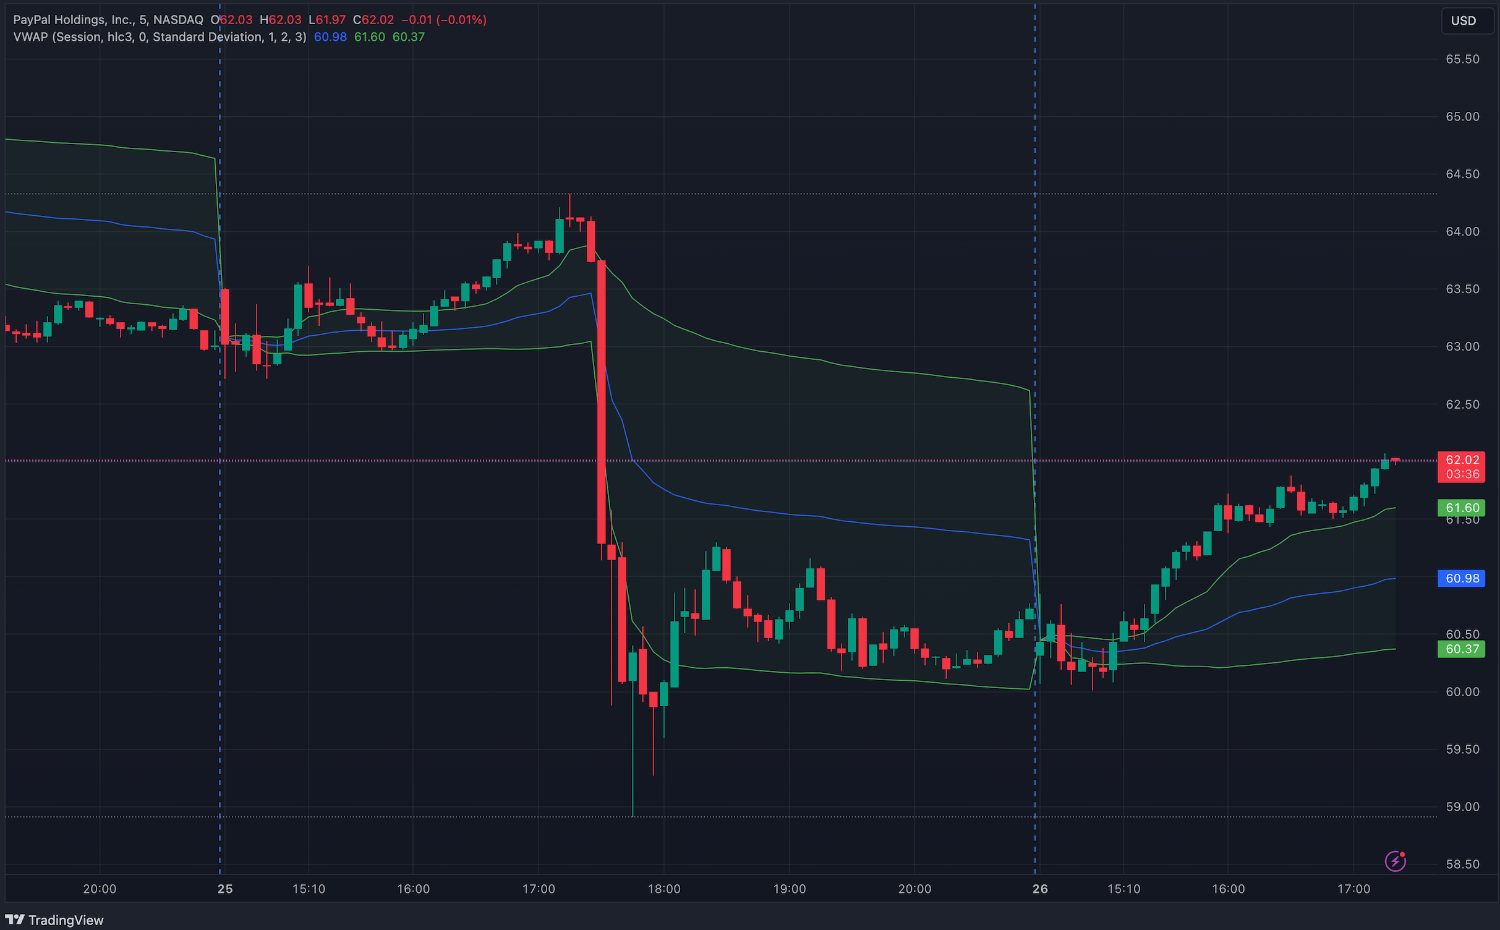
6. Volume-Weighted Average Price (VWAP)
The VWAP, or Volume Weighted Average Price, can be used to measure the average price of a security, taking into account both price and volume.
It is calculated by summing up the product of each price and its corresponding volume, divided by the total volume over a specific time period.
For day trading, the VWAP can be effectively used in the following ways:
Benchmark For Intraday Trading
Compare the current market price to the VWAP to assess whether the asset is trading above or below the average traded price, providing insights into the current trend and potential overbought or oversold conditions.
Trend Confirmation
When the current market price is consistently above the VWAP, it may indicate a bullish trend, suggesting that traders are willing to pay prices higher than the average. Conversely, prices consistently below the VWAP may indicate a bearish trend.
Reversion To The Mean
Traders often look for opportunities when the current market price deviates significantly from the VWAP. If the price is well above the VWAP, some traders may anticipate a potential reversion to the mean and consider short positions, and vice versa for prices well below the VWAP.
Volume Confirmation
The VWAP considers both price and volume, making it a valuable tool for confirming the strength of a price move. Large price movements accompanied by high volume and a significant deviation from the VWAP may signal a more robust and sustainable trend.
Execution & Entry/Exit Points
The VWAP can be used to determine entry and exit points for day trades. The VWAP can also be considered as a dynamic support or resistance level, so you’d enter trades when the price crosses above or below the VWAP.
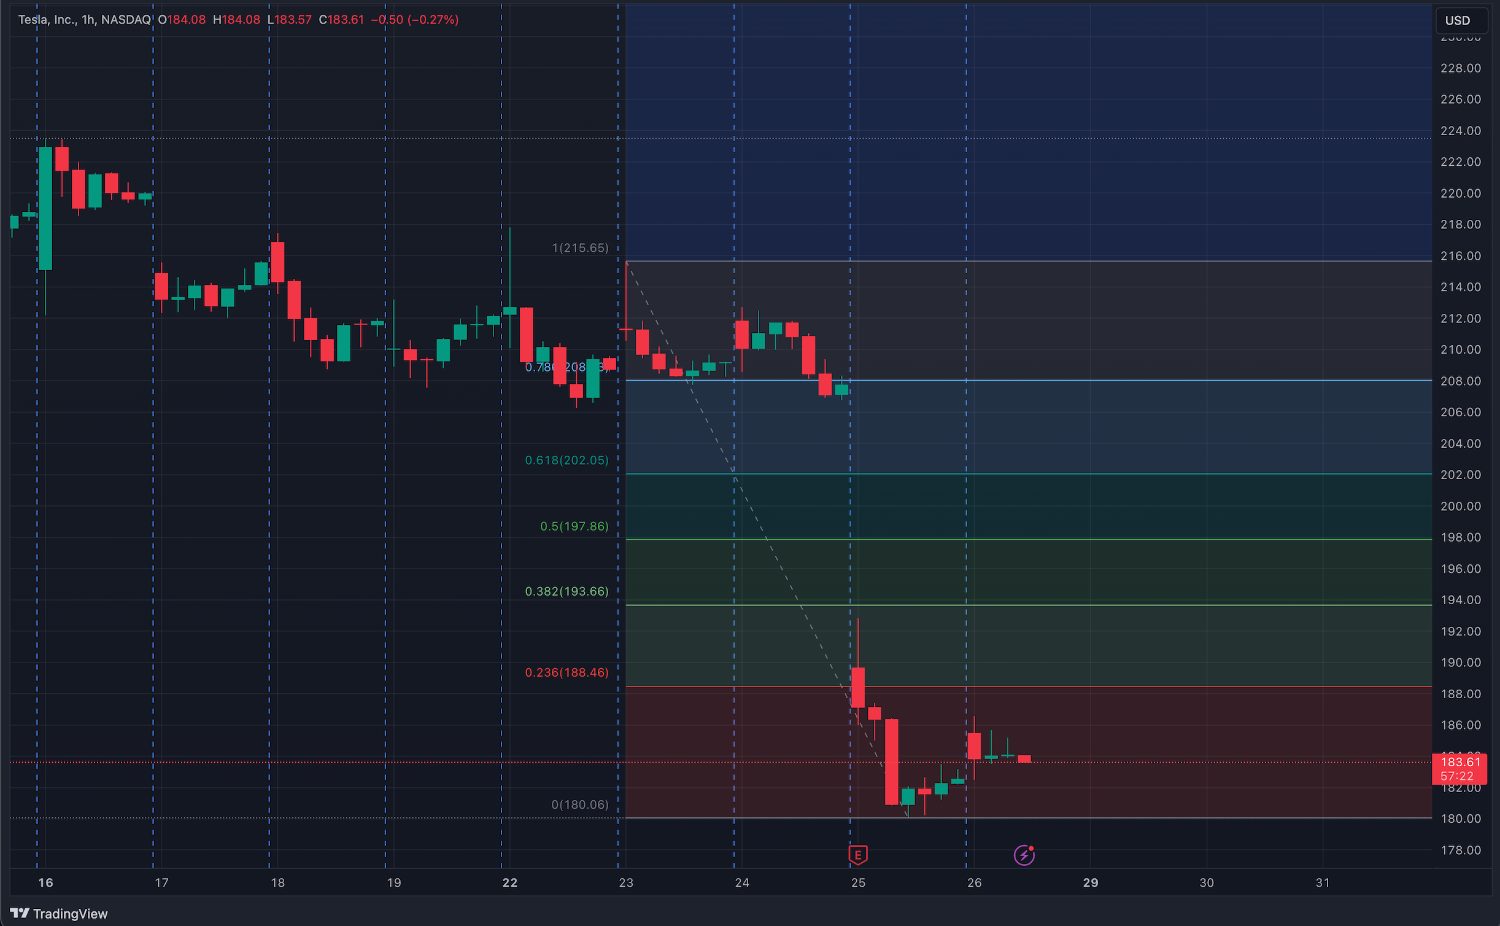
7. Fibonacci Retracement
The Fibonacci Retracement is a technical analysis tool based on the Fibonacci sequence, a mathematical concept where each number is the sum of the two preceding ones.
Fibonacci retracement indicators are generated by determining the distance between two significant points (typically the peak and trough), dividing that distance by a Fibonacci number, and subsequently drawing trend lines from each of those points to the current price level.
These levels are typically at 23.6%, 38.2%, 50%, 61.8%, and 78.6% of the price move being analyzed.
A Fibonacci extension represents a continuation pattern, whereas a Fibonacci retracement can be either a continuation or a reversal pattern. The primary distinction lies in their behavior when breaking from a trend line:
- A Fibonacci extension tends to prolong the preceding move,
- A Fibonacci retracement, when breaking from a trendline, is inclined to reverse in the opposite direction.
For day trading, Fibonacci retracement can be effectively used in the following ways:
Identifying Support & Resistance
Fibonacci retracement levels can be used to identify potential support and resistance levels in a price chart. The key levels, especially the 38.2%, 50%, and 61.8% levels, are often considered significant areas where price may stall or reverse.
Trend Confirmation
When the market is in an uptrend, you may look for pullbacks to Fibonacci support levels as potential buying opportunities. Conversely, in a downtrend, retracements to Fibonacci resistance levels may present opportunities for short positions.
Entry & Exit Points
Fibonacci retracement levels can be used to determine entry and exit points for day trades. You may enter a long position near Fibonacci support levels with the expectation of a bounce, or you may exit a long position near Fibonacci resistance levels. Conversely, short positions may be considered near Fibonacci resistance levels and covered near support levels.
Measuring Price Corrections
Fibonacci retracement can help you gauge the extent of a price correction within a larger trend. Understanding the depth of retracement can provide insights into the strength of the prevailing trend.
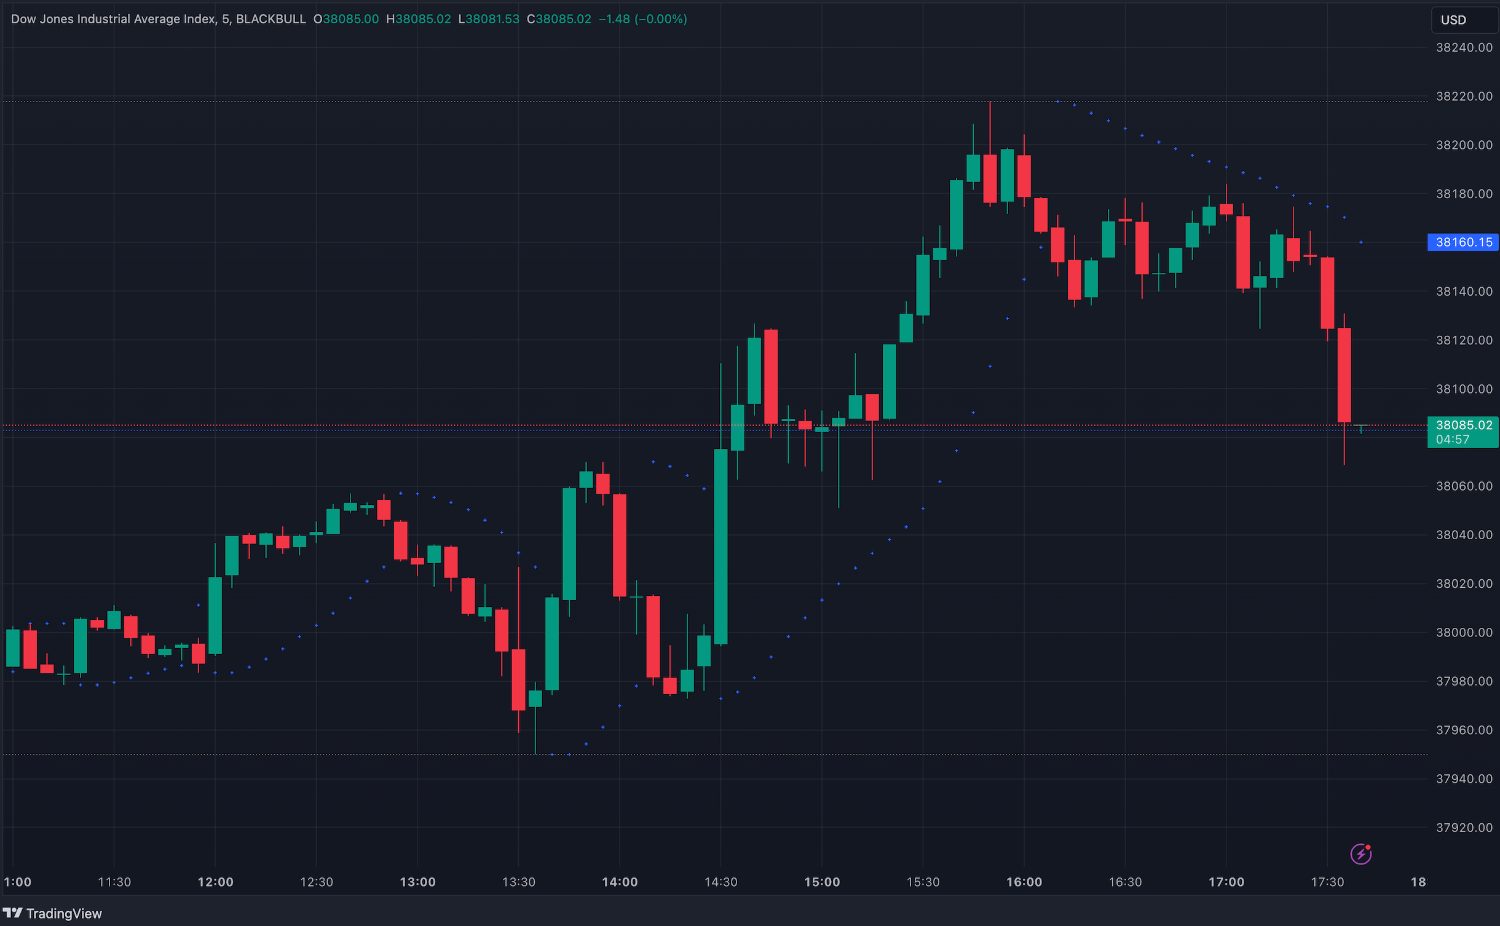
8. Parabolic SAR (PSAR)
The Parabolic Stop and Reverse (SAR) is a momentum indicator that can be used to identify potential reversals in the direction of price movement. It is particularly effective for setting trailing stop-loss levels.
The PSAR appears as dots above or below price candles, indicating potential trend changes. It stands out as an enhancement to conventional moving average crossover systems due to its more intuitive method for identifying signal changes.
For day trading, the PSAR can be effectively used in the following ways:
Trend Identification
The PSAR can help you to identify the prevailing trend. When the dots are below price candles, it suggests an uptrend, and when above, it indicates a downtrend. This information is valuable for aligning trades with the direction of the trend.
Trailing Stop-Loss
The PSAR can be effective when used as a trailing stop-loss tool. As the price moves in your favor, the dots move closer to the price. If the price touches or moves beyond the dots, it may signal a potential reversal, prompting you to exit the day trade.
Reversal Signals
The indicator can provide signals for potential trend reversals. When the dots switch sides (moving from below to above or vice versa), it may indicate a shift in the direction of the trend, allowing you to consider changing your positions accordingly.
Entry Points
The PSAR can be used to identify entry points. For example, entering a long position when the dots flip below price candles in an uptrend or entering a short position when the dots move above price candles in a downtrend.
9. Stochastic Oscillator
The Stochastic Oscillator is a momentum indicator used to assess the relative position of a current closing price in relation to its price range over a specified period.
It consists of two lines, %K and %D, and oscillates between 0 and 100. The indicator is particularly useful for identifying overbought and oversold conditions in the market.
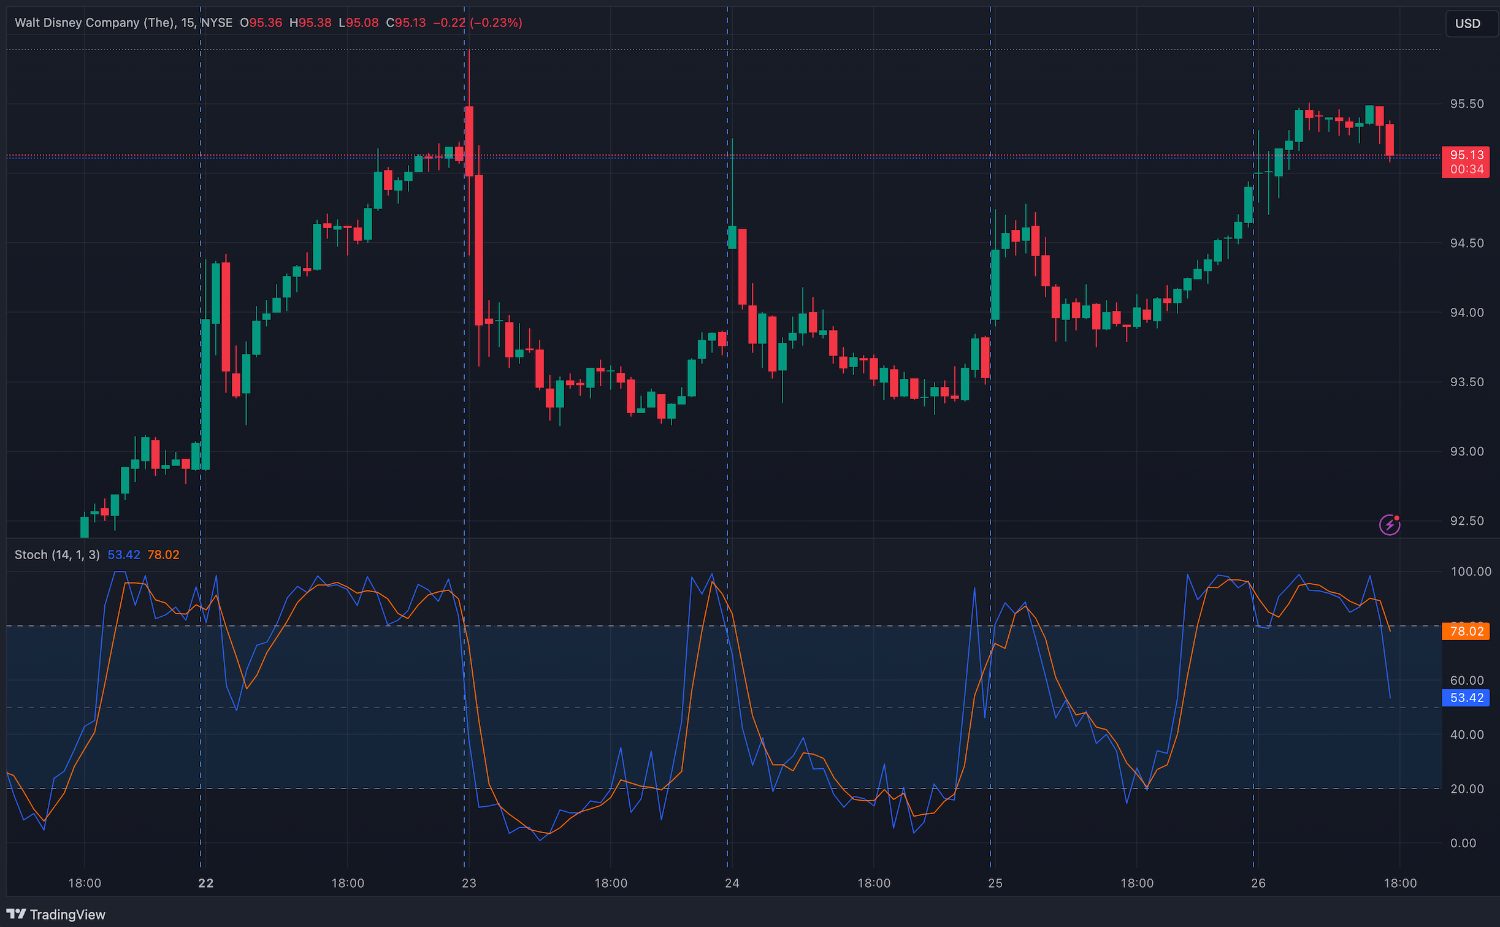
For day trading, the Stochastic Oscillator can be effectively used in the following ways:
Overbought & Oversold Conditions
The Stochastic Oscillator helps identify overbought and oversold conditions. Readings above 80% suggest overbought conditions, indicating a potential reversal or pullback, while readings below 20% suggest oversold conditions, signaling a potential upward reversal.
Crossover Signals
Line crossovers can be used as potential buy or sell signals. A bullish crossover occurs when the %K line crosses above the %D line, signaling a potential buying opportunity. Conversely, a bearish crossover, when %K crosses below %D, may indicate a potential selling opportunity.
Divergence Analysis
Similar to other oscillators, you can analyze divergences between the Stochastic Oscillator and price movements. Bullish divergence occurs when the price makes lower lows, but the Stochastic makes higher lows, suggesting potential upward momentum. Bearish divergence occurs when the price makes higher highs, but the Stochastic makes lower highs, indicating potential downward momentum.
Trend Confirmation
The Stochastic Oscillator can be used to confirm the strength of a trend. In an uptrend, the Stochastic readings tend to remain in the overbought zone for extended periods, while in a downtrend, readings often stay in the oversold zone for extended periods.
10. Average Directional Index (ADX)
The Average Directional Index (ADX) can be used to measure the strength and direction of a trend. It is part of the broader family of indicators known as the Directional Movement Index (DMI).
The ADX does not provide the direction of the trend but quantifies its strength on a scale from 0 to 100.
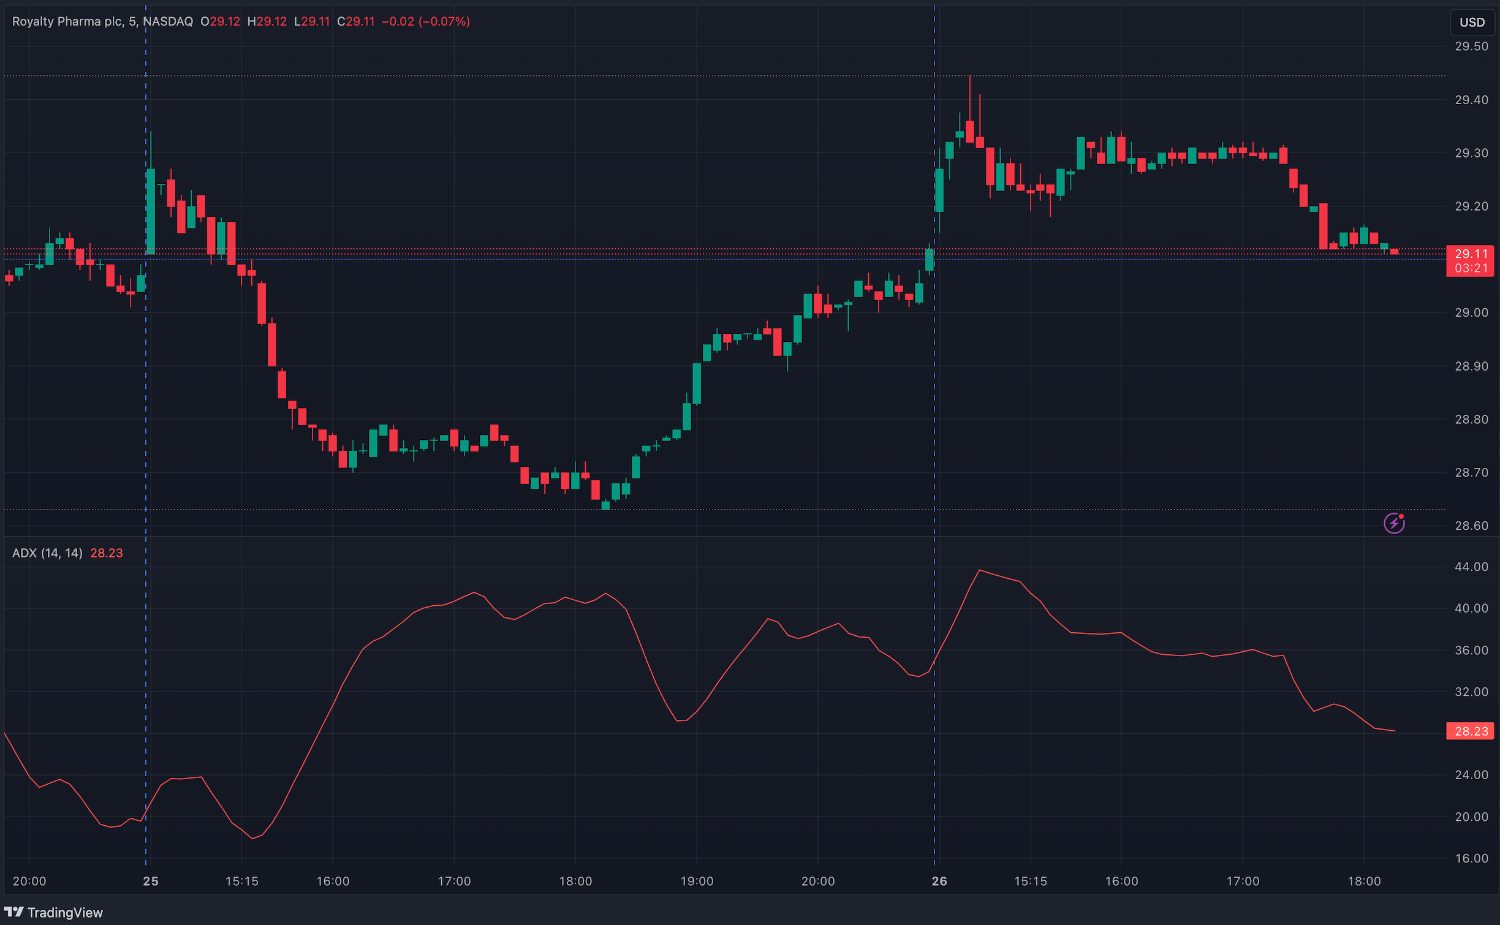
For day trading, the ADX can be effectively used in the following ways:
Trend Strength Identification
The ADX helps to assess the strength of a prevailing trend. A higher ADX reading indicates a stronger trend, while a lower reading suggests a weaker trend or a ranging market. This information can help you to select trending markets for potential day trading opportunities.
Trend Confirmation
The ADX is usually used in conjunction with other trend-following indicators to confirm the presence of a trend. For example, a rising ADX in combination with upward-sloping moving averages may signal a strong uptrend, providing confidence for long positions.
Divergence Analysis
You can analyze divergence between the ADX and price movements. For instance, if the price makes higher highs, but the ADX fails to confirm with higher readings, it may indicate weakening trend strength and a potential reversal.
Volatility Assessment
The ADX can also be used to gauge the volatility of a market. A rising ADX suggests increasing volatility, while a falling ADX indicates decreasing volatility. This information can be valuable for adjusting trading strategies based on market conditions.
Bottom Line
Day trading indicators are tools used to analyze market data and derive insights into potential price movements. They can be valuable when used judiciously, offering objective signals and aiding in decision-making.
However, relying solely on indicators without understanding their limitations or using them in isolation can lead to inaccurate assessments and poor day trading decisions. Effectiveness lies in how well you comprehend, combine, and interpret indicators within the broader context of market analysis.
FAQ
What Are Day Trading Indicators?
A technical indicator is a mathematical calculation based on historical market data designed to help day traders analyze and forecast future price movements. These tools provide visual or numerical representations of market trends, momentum, and volatility.
What Are The Best Indicators For Day Trading?
There isn’t a one-size-fits-all answer to the best indicator for day trading as effectiveness depends on individual preferences and market conditions.
Popular choices include moving averages, relative strength index (RSI), and stochastic oscillators, but it’s crucial to experiment and select indicators that align with your strategy and trading style.
Are Paid-For Day Trading Indicators More Accurate?
The accuracy of day trading indicators is not solely determined by whether they are paid or free; it depends on the methodology and underlying algorithms.
While some paid-for indicators may offer advanced features and better support, you should assess performance, reviews, and compatibility with your strategy before choosing any indicator, regardless of cost.
Which Platform Has The Best Day Trading Indicators?
Popular platforms include MetaTrader 4, MetaTrader 5 and TradingView, cTrader, each known for their diverse indicator libraries and user-friendly interfaces.
That said, determining the platform with the best indicators depends on individual preferences and trading needs, as various platforms offer a range of indicator options.
Article Sources
The writing and editorial team at DayTrading.com use credible sources to support their work. These include government agencies, white papers, research institutes, and engagement with industry professionals. Content is written free from bias and is fact-checked where appropriate. Learn more about why you can trust DayTrading.com