How To Use Charts For Day Trading


Charts are the heartbeat of informed trading, especially for day traders. Whether you’re a seasoned trader or just stepping into the financial world, mastering these visual representations is crucial.
In this guide, we’ll demystify trading charts, empowering you to decipher patterns, trends, and indicators with confidence.
Quick Introduction
- Charts offer various timeframes, from minutes to months or even years, to provide a historical perspective so you can assess short-term movements through to long-term trends.
- Typically displayed through candlesticks, bars, or lines, price data illustrates an asset’s open, high, low, and close values within a specific timeframe. These visuals help identify price trends and patterns.
- Trading charts can incorporate various technical indicators, which overlay additional data onto the price chart, offering insights into market momentum, volatility, and potential reversals.
- Volume bars or histograms depict the amount of trading activity in a specific timeframe and help confirm the strength of a trend or signal potential reversals, as higher volume often accompanies price movement.
- Patterns such as head and shoulders, triangles, or flags emerge within the price data, and can signal potential future price movements.
Brokers With The Best Trading Charts
We've tested the charting software at a long list of brokers and recommend these 4 firms:
-
1
 Interactive Brokers
 -
2
 NinjaTrader
 -
3
 eToro USAeToro USA LLC and eToro USA Securities Inc.; Investing involves risk, including loss of principal; Not a recommendation
 -
4
 Plus500USTrading in futures and options involves the risk of loss and is not suitable for everyone.
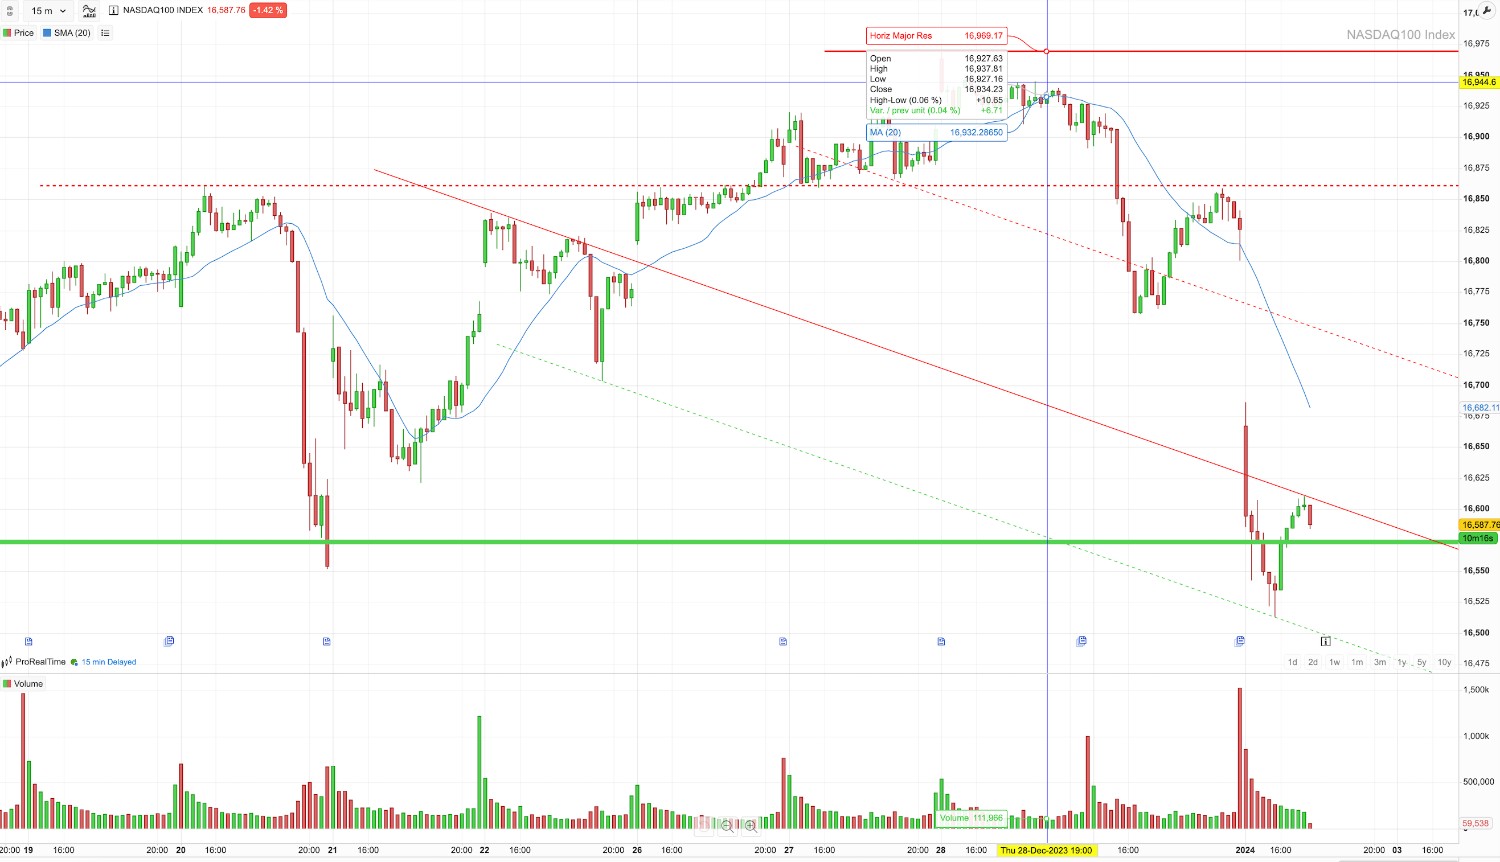
All the live price charts on DayTrading.com are delivered by TradingView, which offers a range of accounts for anyone looking to use advanced charting features.
Live Chart
Download our free How To Use Charts For Day Trading PDF.
Understanding Trading Charts
Trading charts are important because they provide a visual representation of historical price movements and patterns.
They enable you to analyze market trends, identify potential entry and exit points, apply technical indicators for informed decision-making, gauge market sentiment, and formulate trading strategies.
They are particularly important for day traders, who tend to use technical analysis to capitalize on market opportunities effectively.
Charts are the storytellers of the financial markets, revealing the past, guiding the present, and hinting at the future.
Types of Charts
There are several types of trading charts, each presenting price data in a different format and each with its own benefits and drawbacks.
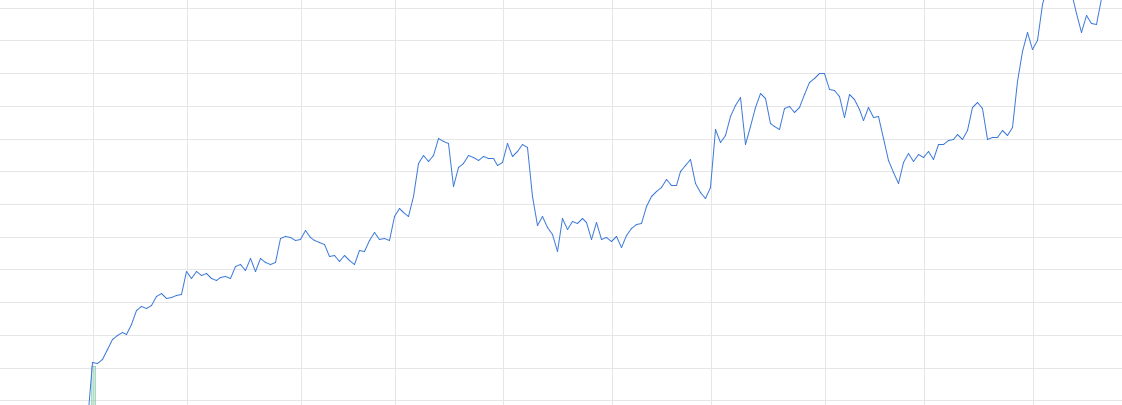
Line Chart
Line charts offer simplicity and clarity, displaying trends through connected closing prices. They provide a smooth overview of long-term trends, aiding strategic decisions.
However, their limited data – omitting highs, lows, and opening prices – makes them inadequate for detailed analysis and less suitable for short-term trading strategies reliant on precise price movements.
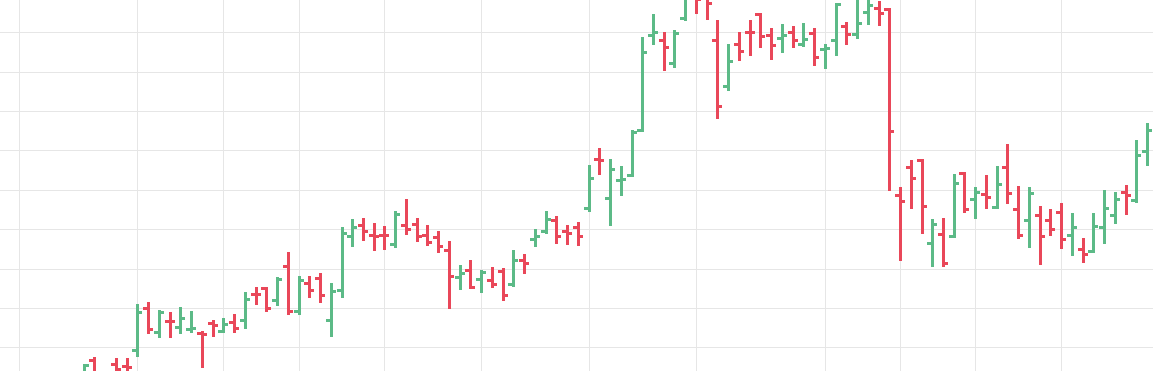
Bar Chart
Bar charts present comprehensive price data, displaying opening, high, low, and closing prices within each bar. They offer a detailed view of price movements, aiding in identifying key levels and patterns for technical analysis.
If the opening price is lower than the closing price, the line will usually be black and red. If the opening price is higher than the closing price, the line is green.
Bar charts effectively extend line charts, adding the open, high, low, and close. They remain relatively straightforward to read while giving you some crucial information line charts fail to do.
However, they can be visually overwhelming with a lot of information packed into each bar, potentially complicating quick trend assessments.
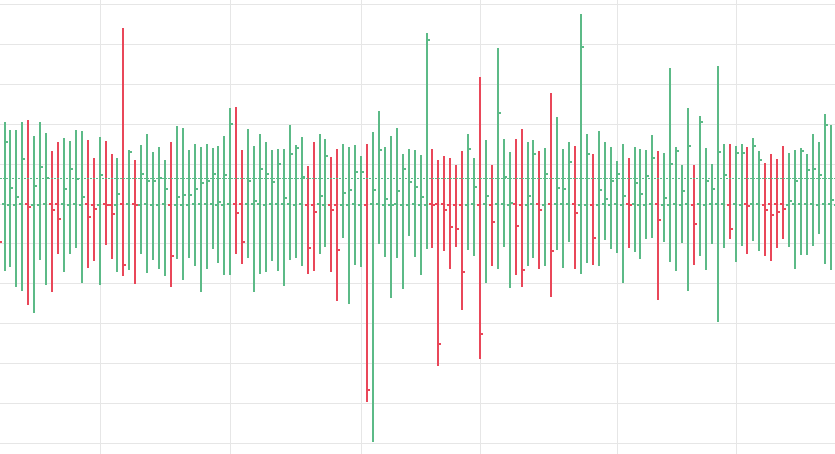
Tick Chart
Day trading with tick charts isn’t common, but some swear by it. The bars on a tick chart develop based on a specified number of transactions. So, a 415 tick chart creates a new bar for every 415 transactions, for example.
They allow you to time your entries with ease, hence why many claim tick charts are best for day trading.
They won’t be impacted by time, so when there is high trading activity, you may have a bar form every minute, but it may take several hours if there is slow trading.
This means in high-volume periods, a tick chart will show you more crucial information than many other variations.
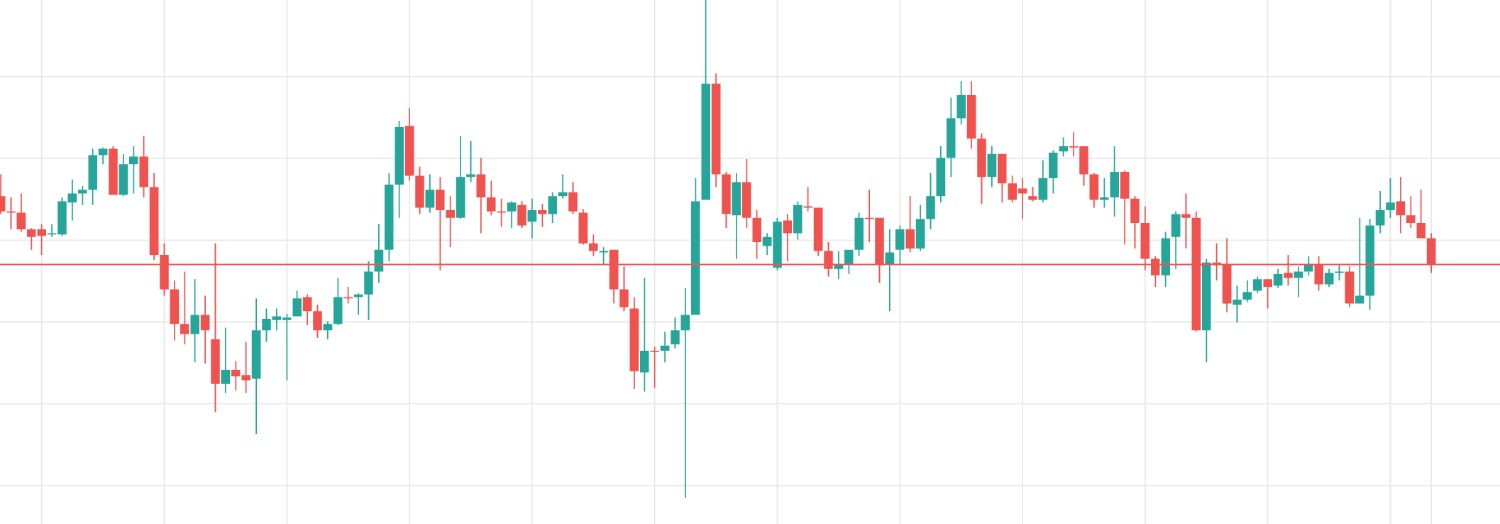
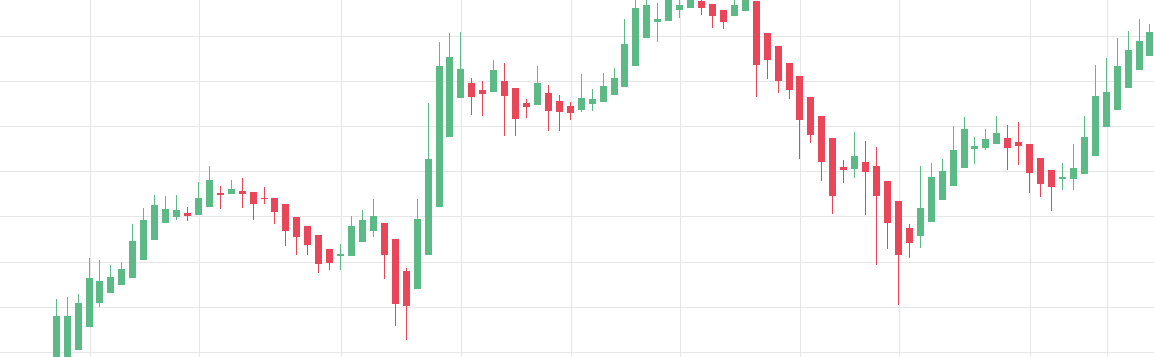
Candlestick Chart
Candlestick charts provide a visually rich representation of price data, displaying opening, high, low, and closing prices in a format that’s easily interpretable.
Their ability to vividly illustrate market sentiment and patterns, like bullish and bearish reversals, can help in decision-making.
Day trading using candlestick charts is particularly popular as they provide more information than a simple line chart.
However, their complexity might overwhelm beginners, requiring familiarity with candlestick patterns for effective analysis.
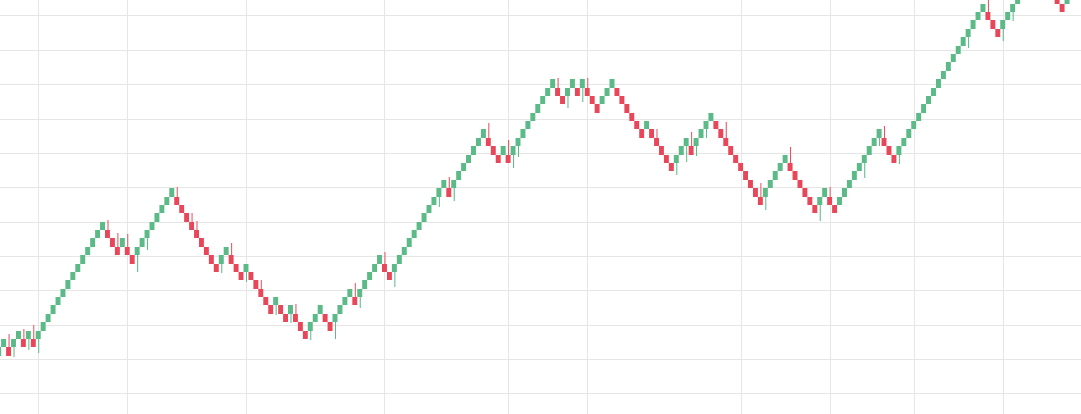
Heikin-Ashi Chart
Heikin-Ashi charts offer a smoothed representation of price movements, filtering noise and providing a clearer view of trends and reversals.
They can help you to identify trends more easily due to their modified calculation method for open, close, high, and low prices.
However, this smoothing effect can sometimes lag behind actual price movements, potentially causing delayed signals compared to traditional candlestick charts.
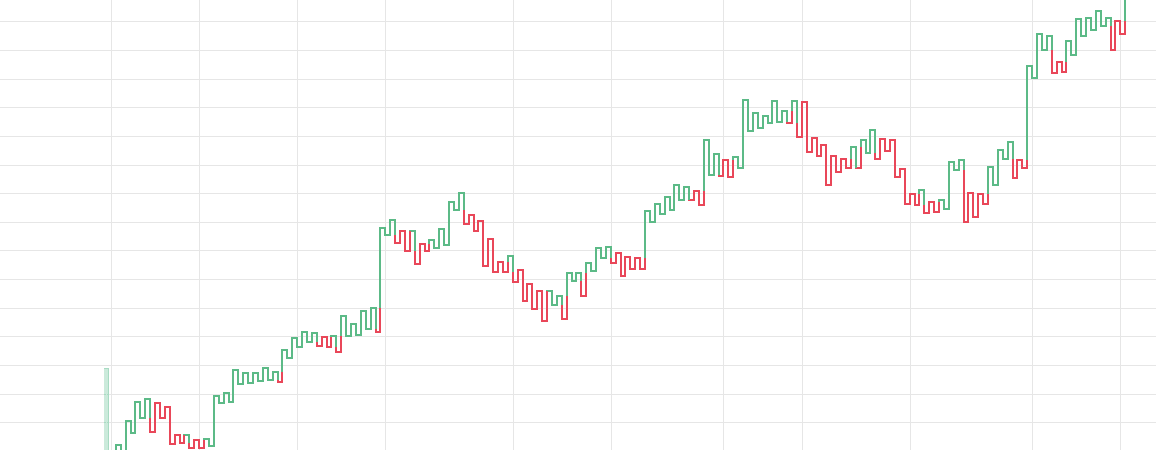
Renko Chart
Renko charts focus solely on price movements, filtering out noise and providing a clear depiction of trends by using bricks or blocks that form only when the price surpasses a predefined amount.
Their simplicity aids in trend identification and removes insignificant price fluctuations.
However, they disregard time, which can lead to delays in recognizing trend changes, and their fixed brick size might not suit all market conditions, making them less adaptable in certain volatile environments.
Kagi Chart
Kagi charts excel in portraying trends by emphasizing price movements, disregarding time intervals. They exhibit clear trend reversals, aiding in decision-making by filtering noise and focusing on significant price shifts.
A Kagi chart needs the reversal amount you specify in percentage or price change. Then, the chart changes direction once the price turns in the opposite direction by the pre-determined reversal amount.
You will see different line widths in a Kagi chart. The line will thicken if the market gets higher than a previous swing. Likewise, the line will thin when it heads below an earlier swing.
They are suitable for day trading because they emphasize the break-out of swing highs and lows. They are also useful for finding support and resistance levels, enabling you to track market bias.
However, their sensitivity to price fluctuations can result in frequent reversals, potentially generating multiple false signals, making them challenging to interpret accurately without proper analysis.
How To Use Charts For Day Trading
You can use charts to day trade in 3 steps:
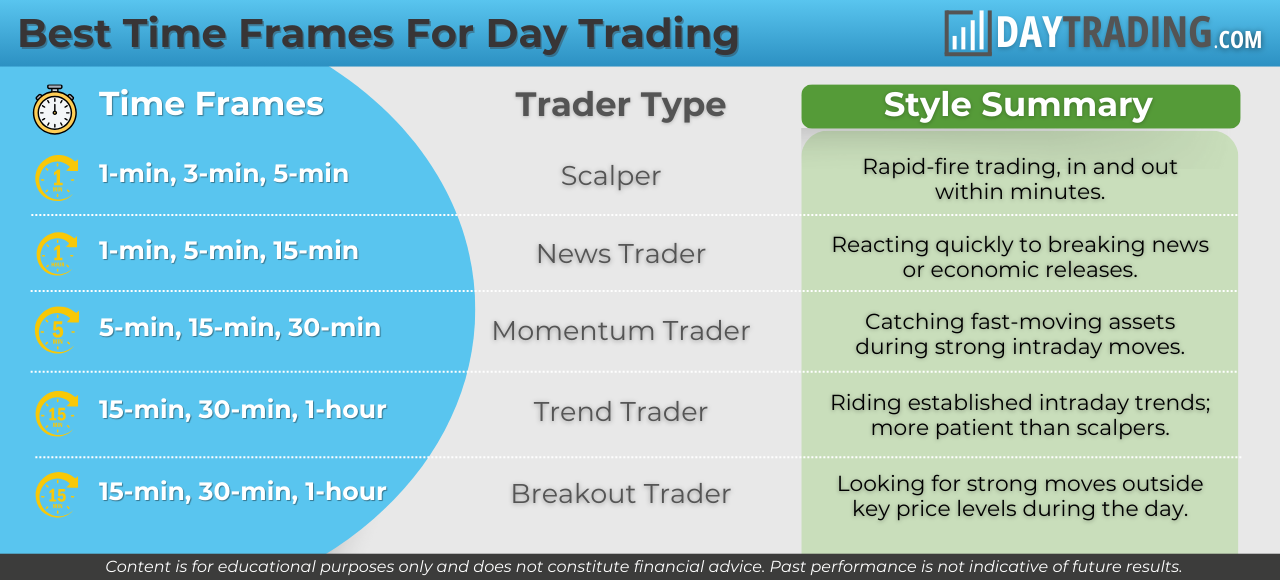
Select a Time Frame
Different chart timeframes offer versatile perspectives on price movements, enabling you to analyze markets based on your trading objectives.
Shorter timeframes, like intraday charts, provide detailed insights into immediate price actions, ideal for day trading, but they involve more noise and require constant monitoring.
Common choices for day trading include 1-minute, 5-minute, and 15-minute charts.
Conversely, longer timeframes, such as weekly or monthly charts, offer a broader view of market trends, suitable for swing trading, yet they might overlook short-term fluctuations that could impact entry or exit points if you are focused on shorter horizons.
I recommend keeping an eye on multiple timeframes. While your primary analysis might be on a specific timeframe, checking higher and lower timeframes can provide a broader perspective and confirm or refine your trading decisions.
Identify Chart Patterns
With thousands of opportunities on your chart, how do you know when to enter and exit a position? Well, you have to look for the best day trading patterns.
Patterns help you predict future price movements and they work on the basis that history repeats itself.
You will usually find two themes in your chart analysis, breakouts and and reversals. The former is when the price clears a pre-determined level on your chart. The latter is when there is a change in a price trend.
Learn common chart patterns like triangles, flags, and head and shoulders. These patterns can provide insights into potential price movements and help you make more informed trading decisions.
Incorporate Technical Indicators
Indicators are tools used to analyze market data and derive insights into potential price movements. They can be valuable when used judiciously, offering objective signals and aiding in decision-making.
However, relying solely on indicators without understanding their limitations or using them in isolation can lead to inaccurate assessments and poor trading decisions.
Effectiveness lies in how well you comprehend, combine, and interpret indicators within the broader context of market analysis.
Popular indicators include:
- Volume indicator – It won’t tell you how the price will go. However, it will let you know if there are many transactions being made and whether the big players are in the game.
- Simple moving average (SMA) – A 10-period moving average is one of the most prevalent indicators amongst intraday traders. It will highlight a significant price move early and show you in which direction. Opt for a slower moving average, and you may lose profit when the trend ends or reverses.
- Average true range (ATR) – This shows an accurate depiction of volatility based on the actual price of the instrument. It gives you no choice but to assess each security individually, helping to ensure precise decisions are made.
- Oscillators – These are a group of indicators that usually flow between the upper and lower bounds. They come in handy when a trend is not visible. The most popular are RSI, MACD, Stochastic Oscillator, and Commodity Channel Index.
Importantly, not all indicators work the same with all time frames. You may find lagging indicators work the best with less volatility, such as moving averages. You might then benefit from a longer period moving average on your daily chart than if you used the same setup on a 1-minute chart.
I recommend on mastering a few key indicators or patterns rather than overwhelming yourself with numerous tools. Deep understanding and proficiency in a select few indicators or patterns can often yield better results than a surface-level grasp of many.
Third-Party Charting Platforms
There’s a wide variety of charting software available, spanning from mobile applications to online platforms.
The best charting software streamlines the creation of visually appealing charts and ensures easy access to a comprehensive array of technical analysis tools with just a few clicks.
While most brokerages provide charting software, there are more specialized options. For beginners, the standard software from your broker will typically suffice.
All of the well-known charting software options listed below feature line, bar, and candlestick charts, along with robust customization capabilities:
- MetaTrader: This platform is ideal if you are looking for daily forex charts. Trading with MT4 and MT5 offers in-depth and easy-to-navigate charting solutions. You also get numerous time frames to choose between. Many of the best brokers offer access to the MetaTrader suite.
- TradingView: Get real-time charts for day trading on 1, 3, 5, and 15-minute time frames, among others. You get hundreds of technical indicators and the ability to set up watch lists and alerts with this market-leading software. We also think it excels for its modern design and ease of use, which has seen it become increasingly popular in recent years.
- NinjaTrader: This low-cost integrated trading and charting software system offers crystal clear charts in every format under the sun. You also benefit from research tools and a handy trading simulator. NinjaTrader is one of the best charting solutions in 2026.
- eSignal: You get extensive customizability but a relatively limited selection of technical indicators. eSignal is suitable for beginners looking to familiarize themselves with trading charts.
Pros & Cons Of Trading With Charts
Pros
- Trading charts visually depict price movements and patterns over time, helping you to analyze historical data to identify trends and potential opportunities.
- Charts incorporate various technical indicators and tools, such as moving averages, RSI, MACD, etc., assisting you to conduct in-depth analysis to make informed trading decisions.
- Charts offer various timeframes, catering to different trading styles and strategies – you can benefit from minute charts for short-term trading, or utilize daily, weekly, or monthly charts for long-term trading.
- Chart patterns, like head and shoulders, triangles, and flags, help you to anticipate potential future price movements and determine entry and exit points.
- Charts display volume alongside price movements, providing insights into market activity and validating the strength of trends or potential reversals. Understanding price data, including highs, lows, opens, and closes, is fundamental for comprehensive analysis.
Cons
- For beginners, charts can initially appear complex, with numerous indicators and patterns that may be challenging to understand without proper education or experience.
- Interpreting trading charts involves a degree of subjectivity, as different traders may perceive patterns or indicators differently, leading to varying analyses and potential biases.
- Incorrectly interpreting patterns or indicators on charts can lead to poor trading decisions, causing financial losses if not used accurately.
- In some cases, especially with certain indicators or chart types, there can be a lag between the actual market movement and the signal or pattern displayed on the chart, affecting the timeliness of decision making.
- Charts heavily rely on historical price data, and unexpected market events or changes can sometimes challenge the effectiveness of chart analysis, especially in highly volatile or unprecedented market conditions.
Bottom Line
Effectively utilized, day trading charts enable the analysis of past price data, enhancing your ability to forecast future market changes. Numerous charting software options, some free, are available.
My tip is to seek out platforms with extensive customization and a diverse array of technical tools, empowering you to discern significant patterns with precision.
Sign up with one of our best brokers for trading charts.
FAQ
What Are Trading Charts?
Trading charts are visual representations of historical price movements in financial markets, offering insights into past trends and patterns.
They serve as tools for you to analyze market behavior, identify potential opportunities, and make informed decisions based on technical analysis and historical data.
Is Day Trading With Charts Easy?
While charts offer valuable insights, day trading demands skill, discipline, and constant monitoring, making it a challenging endeavor requiring a deep understanding of market behavior and quick decision-making.
How Do I Start Trading With Live Charts?
To start trading with trading charts, begin by familiarizing yourself with different chart types, technical indicators, and analysis techniques. Choose a trading platform that offers robust charting tools and practice using them with historical data.
Develop a strategy, start with a small investment, and gradually increase your involvement as you gain confidence and experience in interpreting and utilizing trading charts effectively.
Is There Free Charting Software For Day Trading?
Yes, there are several free charting software options available for trading. Many brokerage platforms offer built-in charting tools with various technical indicators at no additional cost.
Additionally, some independent websites or software providers offer free charting tools with basic features to access chart analysis without a subscription fee.
What Is The Best Chart Type For Day Trading?
The best chart for day trading often depends on personal preference and trading style. However, many day traders favor candlestick charts for their clarity in displaying price movements, making it easier to identify patterns and execute short-term trades.
Heikin-Ashi charts are also popular for their ability to filter out noise.
Which Trading Platform Has The Best Charts?
The best trading platform for charts often depends on personal preferences and trading needs. That said, platforms like TradingView and MetaTrader 4 are especially popular for their advanced charting tools, extensive technical indicators, and customizable features.
Can You Day Trade Without Charts?
It is possible to day trade without charts. For example, some prop and futures traders trade mainly off order flow tools like DOM/price ladder, news and predefined rules.
But for most people it’s an entirely different, very advanced game, and trying to intraday trade without any visual technical analysis is a bit like trading with a blindfold on, making risk management and consistency harder.
Article Sources
- MetaTrader 4 - Charting & Technical Analysis Platform
- ProRealTime - Charting & Technical Analysis Platform
The writing and editorial team at DayTrading.com use credible sources to support their work. These include government agencies, white papers, research institutes, and engagement with industry professionals. Content is written free from bias and is fact-checked where appropriate. Learn more about why you can trust DayTrading.com