Day Trading Patterns


Chart patterns form a key part of day trading. Candlestick and other charts produce frequent signals that cut through price action “noise”. The best patterns will be those that can form the backbone of a profitable day trading strategy, whether trading stocks, cryptocurrency or forex pairs.
Using Patterns In Day Trading
Every day you have to choose between hundreds trading opportunities. This is a result of a wide range of factors influencing the market. Day trading patterns enable you to decipher the multitude of options and motivations – from hope of gain and fear of loss, to short-covering, stop-loss triggers, hedging, tax consequences and plenty more.
Candlestick patterns help by painting a clear picture, and flagging up trading signals and signs of future price movements. Whilst it’s said you’ll need to use technical analysis to succeed day trading with candlestick and other patterns, it’s important to note that utilising them to your advantage is more of an art form than a rigid science.
You need to learn the power of chart patterns and the theory that governs them. This page will show you how to exploit some of the most popular day trading patterns, including breakouts and reversals. Your ultimate task will be to identify the best patterns to supplement your trading style and strategies.
Used correctly trading patterns can add a powerful tool to your arsenal. This is because history has a habit of repeating itself and the financial markets are no exception. This repetition can help you identify opportunities and anticipate potential pitfalls.
RSI, volume, plus support and resistance levels all aide your technical analysis when you’re trading. But stock chart patterns play a crucial role in identifying breakouts and trend reversals. Mastering the art of reading these patterns will help you make smarter trades and bolster your profits, as highlighted in the highly regarded book “Stock patterns for day trading” by Barry Rudd.
Top Brokers For Day Trading Patterns
-
1
 Interactive Brokers
 -
2
 NinjaTrader
 -
3
 eToro USAeToro USA LLC and eToro USA Securities Inc.; Investing involves risk, including loss of principal; Not a recommendation
 -
4
 Plus500USTrading in futures and options involves the risk of loss and is not suitable for everyone.
Breakouts & Reversals
In the patterns and charts below you’ll see two recurring themes, breakouts and reversals.
- Breakout – A breakout is simply when the price clears a specified critical level on your chart. This level could by any number of things, from a Fibonacci level, to support, resistance or trend lines.
- Reversal – A reversal is a simply a change in direction of a price trend. That change could be either positive or negative against the prevailing trend. You may also hear it called a ‘rally’, ‘correction’, or ‘trend reversal’.
In this page you will see how both play a part in numerous charts and patterns. You can also find specific reversal and breakout strategies.
Candlestick Charts
Candlestick charts are a technical tool at your disposal. They consolidate data within given time frames into single bars. Not only are the patterns relatively straightforward to interpret, but trading with candle patterns can help you attain that competitive edge over the rest of the market.
They first originated in the 18th century where they were used by Japanese rice traders. Since Steve Nison introduced them to the West with his 1991 book ‘Japanese Candlestick Charting Techniques’, their popularity has surged.
Below is a break down of three of the most popular candlestick patterns used for day trading in India, the UK, and the rest of the world.
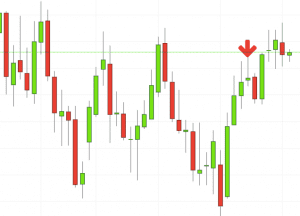
Shooting Star Candlestick
This if often one of the first you see when you open a pdf with candlestick patterns for trading. This bearish reversal candlestick suggests a peak. It is precisely the opposite of a hammer candle. It won’t form until at least three subsequent green candles have materialised. This will indicate an increase in price and demand. Usually buyers lose their cool and clamber for the price to increasing highs before they realise they’ve overpaid.
The upper shadow is usually twice the size of the body. This tells you the last frantic buyers have entered trading just as those that have turned a profit have off-loaded their positions. Short-sellers then usually force the price down to the close of the candle either near or below the open. This traps the late arrivals who pushed the price high. Panic often kicks in at this point as those late arrivals swiftly exit their positions.
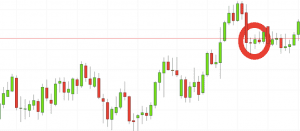
Doji Candlestick
One of the most popular candlestick patterns for trading forex is the doji candlestick (doji signifies indecision). This reversal pattern is either bearish or bullish depending on the previous candles. It will have nearly, or the same open and closing price with long shadows. It may look like a cross, but it can have an extremely small body. You will often get an indicator as to which way the reversal will head from the previous candles.
If you see previous candles are bullish, you can anticipate the next one near the underneath of the body low will trigger a short/sell signal when the doji lows break. You’ll then see trail stops above the doji highs.
Alternatively, if the previous candles are bearish then the doji will probably form a bullish reversal. Above the candlestick high, long triggers usually form with a trail stop directly under the doji low.
These candlestick patterns could be used for intraday trading with forex, stocks, cryptocurrencies and any number of other assets. But using candlestick patterns for trading interpretations requires experience, so practice on a demo account before you put real money on the line.
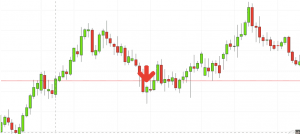
Hammer Candlestick
This is a bullish reversal candlestick. You can use this candlestick to establish capitulation bottoms. These are then normally followed by a price bump, allowing you to enter a long position.
The hammer candlestick forms at the end of a downtrend and suggests a near-term price bottom. The lower shadow is made by a new low in the downtrend pattern that then closes back near the open. The tail (lower shadow), must be a minimum of twice the size of the actual body.
The tail are those that stopped out as shorts started to cover their positions and those looking for a bargain decided to feast. Volume can also help hammer home the candle. To be certain it is a hammer candle, check where the next candle closes. It must close above the hammer candle low.
Trading with Japanese candlestick patterns has become increasingly popular in recent decades, as a result of the easy to glean and detailed information they provide. This makes them ideal for charts for beginners to get familiar with.
More Popular Day Trading Patterns
Morning Consolidation Pattern
Many a successful trader have pointed to this pattern as a significant contributor to their success. Look out for: At least four bars moving in one compelling direction. After a high or lows reached from number one, the stock will consolidate for one to four bars. The high or low is then exceeded by 10:10 am.
It’s easy to see why this pattern is popular for the active day trader. Firstly, the pattern can be easily identified on the chart. Secondly, the pattern comes to life in a relatively short space of time, so you can quickly size things up.
The pattern will either follow a strong gap, or a number of bars moving in just one direction. This means you’ll definitely be in a stock with volatility, an essential component for turning an intraday profit.
Late Consolidation Pattern
It’s often challenging to turn a profit as the day progresses, so it’s probably no surprise to learn that perfecting this trading pattern is no easy feat. In the late consolidation pattern the stock will carry on rising in the direction of the breakout into the market close.
Look out for: Traders entering after 13:00, followed by a substantial break in an already lengthy trend line. Check the trend line started earlier the same day, or the day before. Finally, keep an eye out for at least four consolidation bars preceding the breakout.
There are some obvious advantages to utilising this trading pattern. The stock has the entire afternoon to run. So instead of the hectic morning where you can’t miss a beat, you actually have the time to kick back and watch the play evolve. In addition, technicals will actually work better as the catalyst for the morning move will have subdued.
Stock Patterns
In few markets is there such fierce competition as the stock market. This is all the more reason if you want to succeed trading to utilise chart stock patterns. By viewing a series of stock price actions over a period of time (intraday), you’ll be in a better position to predict how they’re going to behave in future.
Visit our ‘Trading Stocks‘ page for detailed examples of stock trading patterns.
Using Price Action
Many strategies using simple price action patterns are mistakenly thought to be too basic to yield significant profits. Yet price action strategies are often straightforward to employ and effective, making them ideal for both beginners and experienced traders.
Put simply, price action is how price is likely to respond at certain levels of resistance or support. Using price action patterns from pdfs and charts will help you identify both swings and trendlines.
Whether you’re day trading stocks or forex with price patterns, these easy to follow strategies can be applied across the board.
Zone Strategy
So, how do you start day trading with short-term price patterns? Downloading a pdf will likely tell you to employ a ‘zone strategy’. One obvious bonus to this system is it creates straightforward charts, free from complex indicators and distractions.
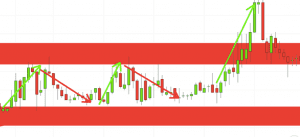
Dead Zone
This empty zone tells you that the price action isn’t headed anywhere. There is no clear up or down trend, the market is at a standoff. If you want big profits, avoid the dead zone completely. No indicator will help you makes thousands of pips here.
The Red Zone
This is where things start to get a little interesting. Once you’re in the red zone the end goal is in sight, and that one hundred pip winner within reach. For example, if the price hits the red zone and continues to the upside, you might want to make a buy trade. It could be giving you higher highs and an indication that it will become an uptrend.
This will be likely when the sellers take hold. If the price hits the red zone and continues to the downside, a sell trade may be on the cards. You’d have new lower lows and a suggestion that it will become a down trend.
The End Zone
This is where the magic happens. With this strategy you want to consistently get from the red zone to the end zone. Draw rectangles on your charts like the ones found in the example. Then only trade the zones. If you draw the red zones anywhere from 10-20 pips wide, you’ll have room for the price action to do its usual retracement before heading to the downside or upside.
Outside Bar At Resistance Or Support
You’ll see a bullish outside bar if today’s low exceeded yesterdays, but the stock still rallies and closes above yesterday’s high. If the complete opposite price action took place, you’d have yourself the perfect bearish example.
Unfortunately, it isn’t as straightforward as identifying an outside candlestick and then just placing a trade. It’s prudent to find an outside day after a major break of a trend.
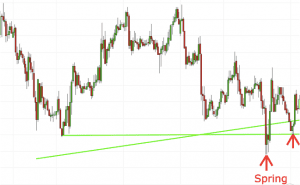
Spring At Support
The spring is when the stock tests the low of a range, but then swiftly comes back into trading zone and sets off a new trend. One common mistake traders make is waiting for the last swing low to be reached. However, as you’ve probably realised already, trading setups don’t usually meet your precise requirements so don’t stress about a few pennies.
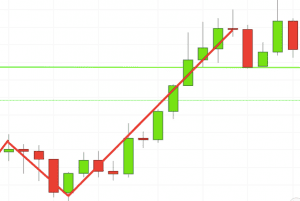
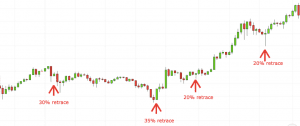
Little To No Price Retracement
Put simply, less retracement is proof the primary trend is robust and probably going to continue. Forget about coughing up on the numerous Fibonacci retracement levels. The main thing to remember is that you want the retracement to be less than 38.2%. This means even when today’s asset tests the previous swing, you’ll have a greater chance that the breakout will either hold or continue towards the direction of the primary trend.
Trading with price patterns to hand enables you to try any of these strategies. Find the one that fits in with your individual trading style. Remember, you’ll often find the best trading chart patterns aren’t overly complex, instead they paint a clear picture using minimal indicators, reducing the likelihood of mistakes and distraction.
Consider Time Frames
When you start trading with your short term price patterns pdf to hand, it’s essential you also consider time frames in your calculations. In your market you’ll find a number of time frames simultaneously co-existing. This means you can find conflicting trends within the particular asset your trading. Your stock could be in a primary downtrend whilst also being in an intermediate short-term uptrend.
Many traders make the mistake of focusing on a specific time frame and ignoring the underlying influential primary trend. Usually, the longer the time frame the more reliable the signals. When you reduce your time frames you’ll be distracted by false moves and noise.
Many traders download examples of short-term price patterns but overlook the underlying primary trend, do not make this mistake. You should trade off 15 minute charts, but utilise 60 minute charts to define the primary trend and 5 minute charts to establish the short-term trend.
Wrapping Up
Our understanding of chart patterns has come along way since the initial 1932 work of Richard Schabacker in ‘Technical Analysis and Stock Market Profits’. Schabacker asserted then, ‘any general stock chart is a combination of countless different patterns and its accurate analysis depends upon constant study, long experience and knowledge of all the fine points, both technical and fundamental…’ So whilst there is an abundance of patterns out there, remember accurate analysis and sustained practice is required to fully reap their benefits.