Volume-Price Trend


Volume-price trend (VPT), sometimes known as price-volume trend, combines price and volume in the market to form a hybrid trading indicator of the two variables. The basic idea behind the indicator is to multiply the market’s volume by the percentage change in the price over a given interval (usually daily). If price declines, the indicator’s value goes lower due to the negative value. If price increases, the indicator’s value goes higher.
Best Volume-Price Trend Brokers
-
1
 Interactive Brokers
 -
2
 NinjaTrader
 -
3
 eToro USAeToro USA LLC and eToro USA Securities Inc.; Investing involves risk, including loss of principal; Not a recommendation
 -
4
 Plus500USTrading in futures and options involves the risk of loss and is not suitable for everyone.
VPT is conceptually very similar to on-balance volume (OBV). With on-balance volume, the indicator increases or decreases based on whether price simply made a new high or low. It does not include the extent of the move into its calculation. With VPT, the indicator moves based on how big of a shift was made in price.
The general premise behind VPT is that the indicator should move in the same direction as price and largely match the magnitude of the move. It is generally assumed that when price moves are accompanied by low volume, this puts a market at risk for a reversal in trend.
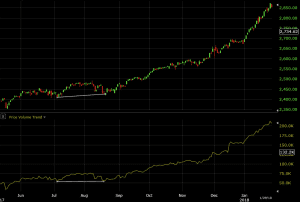
For example, consider the following move in the S&P 500 in January 2018 below. The market’s uptrend accelerated despite no conspicuous shift in volume. This told many technical analysts that the move in the index was tenuous. Accordingly, it set up a scenario where price could decline once more volume entered the market. It eventually did exactly this.
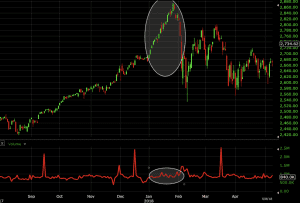
VPT would have only picked up on what a pure volume indicator showed if volume had been declining (given the price move is calculated into VPT). Therefore, the price move largely matched with VPT.
Calculation of Volume-Price Trend
As mentioned above, VPT is measured as volume multiplied by the change in price, and is calculated as a running total from the previous period.
VPT = Previous VPT + Volume x (Today’s Close – Previous Close) / Previous Close
It is traditionally calculated daily, though it can be measured over whatever timeframe with which volume data is available. Note that some charting software platforms do not provide volume data on a timeframe lower than the daily level. Therefore this can also restrict one’s ability to trade using the indicator over multiple time intervals.
Interpretation of Volume-Price Trend
When traders look at VPT and how it relates to price they are fundamentally looking for divergences. When there is a divergence between price and volume it usually tells you something.
If volume stays flat, while price increases, this suggests to a trader that the up move in price was relatively weak and may be prone to reversal. Accordingly, a trader who observes this may be less likely to pursue long trades, expecting the market to increase further.
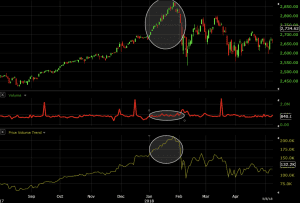
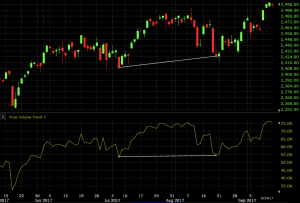
Let’s take a look at the following example:
Here’s the type of divergence we might look for. Price increases, yet VPT actually declined on net. This would imply the up move is fairly weak and may not last. And this is what indeed happened. There was a subsequent drop in the overall market.
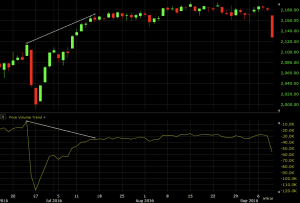
Let’s also look at this one:
This isn’t much, but it’s a slight divergence nonetheless. So we know that price slightly increased while VPT stayed the same.
What does this mean?
It means that volume was the same but price still rose. If volume isn’t accompanying the price this means it may be a weak move that may not hold. Does this mean the bull market is running out of steam?
Well, not exactly, if we look at what price did afterwards.
You cannot trade off one indicator alone.
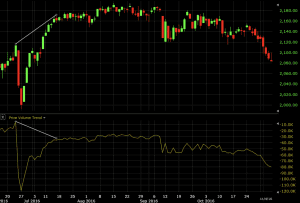
If we look at the chart below, we can see that peaks and troughs in price roughly accord with the same in VPT. However, if we look close enough, we can still see some divergences that are bearish in nature.
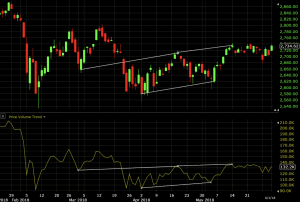
If we draw lines between closing prices and closing VPT values (VPT values match with closing prices, not highs and lows of candles), we can see that price is slanting up while the accordant VPT lines are flat to slightly pointing up as well. This again means that volume-based analysis may imply that the up moves in this market may be relatively weak. This makes bullish trades somewhat riskier than they would be otherwise.
Trading With Volume-Price Trend
No indicator should be used independently to make trade decisions. This would be a form of misuse. They are meant to help better guide trading decisions, or better assist in finding entry points, rather than having one indicator as a standalone system.
If we look at the following chart of Apple stock (AAPL), we see the following divergences in price and VPT.
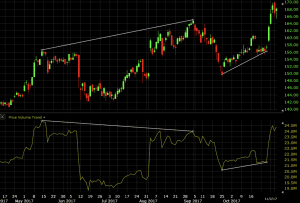
These are, like the previous examples shown above, bearish divergences. Price is going up but the volume isn’t there to support the up move, as evidenced by VPT declining in the first example. In the second divergence, VPT isn’t going up to the same extent as price.
Would there be short trading opportunities here?
It depends on how you approach it. You can use fundamental analysis and/or go further into technical analysis to better make a decision.
For example, let’s say you used a contrarian/price reversal indicator in addition to VPT, such as Keltner Channels, with an average true range of 2.5.
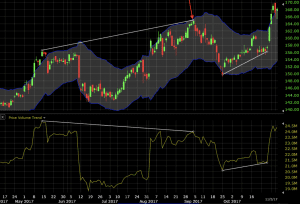
Based on the bearish divergence signal from the VPT and upper touch of the channel, this provides a potential shorting opportunity to consider where the red arrow is marked.
Conclusion
As its name suggests, volume-price trend blends both volume and price to form a cumulative running indicator that gauges the perceived validity of price movements.
The key in valuing VPT in relation to price lies in divergences. If price moves in one direction or another and isn’t matched by at least a concomitant increase in VPT, then traders may perceive the price move as shallow and ripe for reversal.
Bullish divergences will see price going down with VPT up or at least flat. On the other hand, bearish divergences will see price going up with VPT down or at least flat. Price that largely matches up with VPT may help confirm any current trend in the market.