Average True Range


The Average True Range (ATR) measures volatility over a specified time period.
It first generates a component that feeds into the ATR called the “true range”, which is determined by taking the greater value of: 1) the absolute value of the current high minus the previous period’s close or the absolute value of the current low minus the previous period’s close or 2) the current high minus the current low. The ATR is a moving average of the true ranges over a user-defined time period.
Top Brokers For ATR Trading Strategies

Mathematically, the true range is defined as:
True Range = max[(high – low), abs(high – previous close), abs(low – previous close)]
For example, if the S&P 500 has traded between 2,650 and 2,600 for the day, its daily range would be 50 (2,650 minus 2,600).
However, if that trading range does not encapsulate yesterday’s close (or the close for Friday, if the current day is Monday) – say it was 2,590 – the average true range would be calculated as 60 (2,650 minus 2,590).
The average true range of a specific period is calculated as one form of an exponential moving average through the following formula:
Where:
- ATRt = Average true range for period, t
- ATRt − 1 = Average true range for the previous period, t – 1
- TRt = True range for the period, t
- n = Number of periods
The ATR itself is calculated through the arithmetic mean formula:
The indicator’s original developer Welles Wilder recommended a 7- and 14-period smoothing.
Interpretation of the Average True Range
The ATR is a proxy for volatility. For equities, the ATR will tend to spike when the market goes down given fear is a stronger emotion than greed.
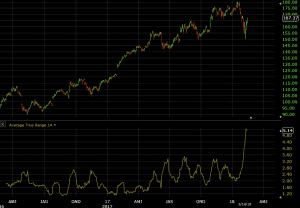
We can see this when plotting the ATR on a weekly S&P 500 chart, with notable ATR spikes during the financial crisis, May 2010 flash crash, 2011 US credit downgrade, 2015 Chinese yuan devaluation and oil/high-yield depreciation, and February 2018 inflation fears:
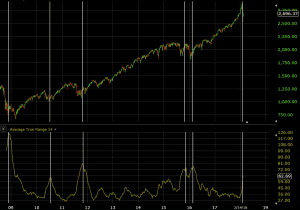
This means on down days traders are more inclined to be active in the market with some people selling to cut losses while some are looking to pick up cheaper assets. Also, more buy and sell limit orders are triggered when price fluctuates.
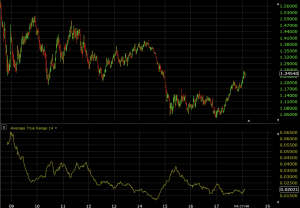
We can see the same with volatility inducing events in the currency markets (in this case EUR/USD), such as the financial crisis, 2010-12 European debt concerns, and the divergence in monetary policies between the US Federal Reserve and European Central Bank in mid-to-late 2014.
When using the ATR on longer timeframes – e.g., weekly chart – spikes in the indicator normally depict market dislocations where notable macroeconomic events change the dynamic of a market.
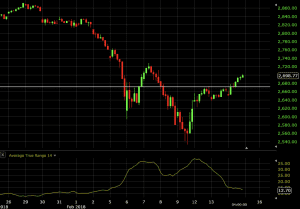
On shorter timeframes, such as the daily Apple (AAPL) chart below, spikes in the ATR are chiefly due to company-specific events, such as quarterly earnings. This is why you get slightly more than four notable upticks during each calendar year – earnings results in addition to other notable corporate events. The early-2018 macroeconomic event (rising inflation expectations) is the most notable over this roughly two-year period as the largest part of a stock’s movement (among macroeconomic, industry-based, and company-based factors) is dictated by the broader market.
Average true range is most appropriately used to identify changes in volatility, which tend to persist over time. For example, if the ATR of a stock is 2.50 one day, and some corporate news brings it up to 5.00 the next, it is unlikely to go back down to 2.50 or lower the next as the market adjusts to new circumstances and as various orders continue to get triggered.
Uses of the Average True Range
In terms of being a volatility indicator, it can serve multiple purposes. It can be used such that its magnitude is inversely proportion to an asset’s position size. This would be a way to ensure that each position’s size within the portfolio is roughly equal in terms of risk.
For example, if a trader wanted a three-asset portfolio where a $100 stock had a $3 ATR over the defined time interval (ATR = 3% of stock’s value), a $75 stock with a $3 ATR (ATR = 4% of stock’s value), and a $50 stock with a $1 ATR (ATR = 2% of stock’s value), to make this equitably weighted by risk, the position sizes would come to: 33.3% of the dollar amount for the $100 stock, 22.2% for the $75 stock, and 44.4% for the $50 stock. This recognizes that the $50 stock is twice as risky as the $75 stock, and the $75 stock is 50% more risky than the $100 stock.
ATR can also be used be used to size stop-losses. If one wants to limit one’s losses to the ATR of the asset’s past 14 days (i.e., ATR with a period setting of 14), one can position the stop-loss accordingly.
If one is trading the S&P 500 from the hourly chart, the ATR is 12.7, and one wants to set the stop-loss to 2x ATR, one would place the stop 25.4 points below (or above) the current price level and adjust as time goes on.
Naturally, there is no hard-and-fast rule for setting stops according to the ATR. It depends on each trader’s individual risk tolerance while also allowing the trade “breathing room” to develop.