Trading On Balance Volume (OBV)


On balance volume (OBV) uses volume to predict security price movements in advance. Like other volume-based indicators, such as the negative volume index, Klinger volume oscillator, and money flow index, it will work only on markets with exchange volume associated with them.
The Top Brokers For Trading OBV
-
1
 Interactive Brokers
 -
2
 NinjaTrader
 -
3
 eToro USAeToro USA LLC and eToro USA Securities Inc.; Investing involves risk, including loss of principal; Not a recommendation
 -
4
 Plus500USTrading in futures and options involves the risk of loss and is not suitable for everyone.
The OBV works by keeping a running tally on volume in accordance with the direction of a security. When the security increases in price, volume is added to the running total making up the OBV figure. When the security decreases in price, volume is subtracted from the running total making up the OBV figure.
When the indicator was developed in the 1960s, the idea was that when volume decreases without an accompanying move in the security, a down move would soon expectedly follow. Similarly, if volume increases without an attendant rise in the security, an upward move is expected to follow.
Example Calculation of On Balance Volume
Let’s take a hypothetical daily set of share price and share volume numbers. We’ll then translate this to on balance volume changes.
- Day 1 = $10.00 share price; volume = 10,000 shares
- Day 2 = $10.10 share price; volume = 12,000 shares
- Day 3 = $10.05 share price; volume = 14,000 shares
- Day 4 = $10.15 share price; volume = 8,000 shares
- Day 5 = $10.12 share price; volume = 9,000 shares
The general idea is that each day the share price is up, OBV increases by the share volume count. On each day the share price is down, OBV decreases by the share volume count.
- Day 1: OBV = 0
- Day 2: OBV = 0 + 12,000
- Day 3: OBV = 12,000 – 14,000 = -2,000
- Day 4: OBV = -2,000 + 8,000 = 6,000
- Day 5: OBV = 6,000 – 9,000 = -3,000
OBV, as demonstrated from this calculation, can be both negative and positive. It also oscillates between positive and negative values as shown on this particular chart of the S&P 500 below.
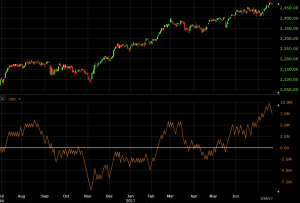
Its value is also dependent on the starting point of the calculation. Since volume is additive when the asset increases in price, the OBV will tend to follow the general trend of the market. It will tend to increase in uptrends and decrease in downtrends.
Uses of On Balance Volume
Like the negative volume index, on balance volume is designed to determine when the “smart” money and “not-so-smart” money are active. It is believed that the money that predominantly moves markets – institutional funds – are most active on low volume days while retail traders and investors are most active on high volume days. (The assumption is that retail traders tend to be more reactive to whipsaw movements in the market than larger investors.)
The idea behind the indicator is that price follows volume, a widely held belief among many technical analysts.
For example, if a market is in a downtrend (i.e., selling outweighs buying), it will take a large influx of buy orders to offset the selling in order to move the market back in the other direction. At first, a lot of these transactions will simply cancel each other out. Price may consolidate and not move appreciably in either direction even though volume is building. Once enough buy orders are in place to outweigh the selling (in terms of how much money is on each side), only then will price reverse and go back up.
Institutional traders may be more likely to buy when volume is low in a flat or declining market. Volume builds and once the buyers start outbidding the sellers, price will eventually follow. As price rises, retail traders are likely to start buying believing its new uptrend suggests that it might be a good investment (rather than the fact that it’s typically getting more expensive). At this point, institutional traders may begin selling to lock in profits.
Trading On Balance Volume
Many traders who use OBV will be less interested in its value but rather its rate of change to help generate trade ideas. If the OBV is moving notably in one direction, it could give credence to the idea that a big move could be coming in that direction in price.
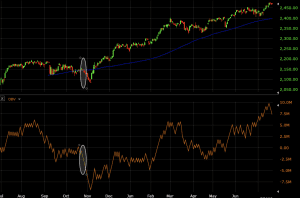
For example, in the chart below (daily chart of the S&P 500), OBV moves down faster than the correspondent move in price. This could tell a trader that a bigger move down in price could be forthcoming. The areas are marked below.
For traders who want to stay with the trend, one could use the OBV in conjunction with a trend following system. For matters of simplicity, I’ve added just a 50-period simple moving average to the price chart. This will provide a basic trend indicator. If the moving average is sloped upward, price will be considered in an uptrend and those trading with the trend will be biased toward long trades. Likewise, if the moving average is sloped downward, price will be considered in a downtrend and may bias one’s trades in favor of short selling.
In the example below, we see a market in an uptrend as identified by the 50-period simple moving average. On the OBV chart below, we see a notable move up, beyond the rate at which price is rising.
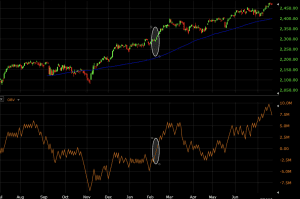
With the uptrend and rising volume combined with a muted reaction in price, a trader might look further into pursuing this opportunity.
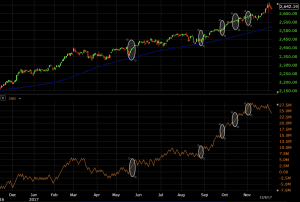
Below I’ve identified other OBV breakout opportunities in the direction of the ongoing trend that a trader following this type of system might wish to consider.
Conclusion
On balance volume is used to determine when the “smart” money and “not-so-smart” money may be most active. Many traders believe that price follows volume.
Therefore, if volume or a volume proxy indicator is increasing while the response in price is more muted, some traders may take notice of this divergence as a clue that price may soon follow. Similarly, when price is moving but volume is low, traders may take this as an indication that the market may be ready to consolidate.
OBV capitalizes on this idea by keeping a running tally of volume when price moves up or down. On up days, volume (e.g., share count) is added to the indicator. On down days, volume is subtracted from the indicator.
OBV can be used in any kind of system – trend following/momentum or price reversal. Traders who are trend followers may use the OBV’s signals in conjunction with indicators that help identify the trend. Likewise, those who prefer to identify potential turning points in the market might combine the OBV with price reversal indicators (e.g., certain types of oscillators, moving average crossover strategies).