Keltner Channels


Keltner channels help measure the volatility in a market by observing how price moves in relation to bands formed by upper and lower moving averages. They are designed similarly to the envelope channel.
The Top Brokers For Keltner Channel Trading
-
1
 Interactive Brokers
 -
2
 NinjaTrader
 -
3
 eToro USAeToro USA LLC and eToro USA Securities Inc.; Investing involves risk, including loss of principal; Not a recommendation
 -
4
 Plus500USTrading in futures and options involves the risk of loss and is not suitable for everyone.
The direction of the Keltner channels show the overall trend of the market. But fundamentally, it is a price reversal indicator.
When price trends above the top band, the market is said to be “overbought”. When price moves below the lower band, the market is said to be “oversold”.
A trader may interpret price moving above the band (“overbought”) to be a signal to sell short. Likewise, one may interpret price moving below the band (“oversold”) to be a signal to buy long.
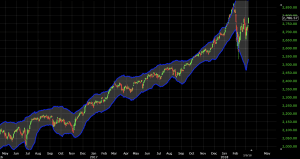
(Keltner channels applied to a daily chart of the S&P 500)
Calculation of the Keltner Channels
Keltner channels rely on average true range in their calculation. The average true range, which is explained in more detail in this article, is whichever is the greatest among the following:
- the absolute value of the current period’s high minus the current period’s low
- absolute value of the difference between the previous period’s close and current period’s high, or
- absolute value of the difference between the previous period’s close and current period’s low
This differs from, for example, Bollinger bands, which use standard deviation to calculate upper and lower bounds. The envelope channel is created using two bands that are a fixed percentage away from an n-period moving average of price.
The Keltner channels are calculated as a function of a moving average of the “typical price” and a multiple of the average true range. Typical price is the sum of the high, low, and close divided by three.
Given the Keltner channels use average true range, the bands are less reactive to price relative to a standard deviation based envelope like Bollinger bands. This generally means more overbought and oversold signals but will depend on the settings (i.e., adjustments of the moving average of the typical price and average true range).
Bollinger bands are nonetheless more popular than Keltner channels. Bollinger bands rely on standard deviation, which is considered more statistically meaningful than the use of the average true range.
For example, when price ventures outside of the Bollinger bands set to a standard deviation of three, traders know exactly what this means in a statistical sense. Namely, it should only happen 0.2% of the time. On the other hand, price moving outside of some multiple of the average true range is less clear in terms of its statistical meaning.
Using Keltner Channels
The higher one sets the moving average of the typical price and average true range, the wider the bands will be. Contrarily, the lower one sets the moving average of the typical price and average true range, the narrower the bands will be. Wider bands will send fewer, more conservative signals. Narrower bands will send more, but less reliable signals.
It fundamentally depends on how reliant one is on the Keltner channels to generate trade signals. If one depends on them heavily, then it would be more realistic to have wider bands to avoid a glut of unreliable signals. If one uses a greater variety of indicators and analytical methods to guide his or her trading, then having narrower bands and using it as one tool among many to help with trade generation could be a viable approach.
Trading Examples of the Keltner Channels
Example #1
As mentioned, the settings for the Keltner channels are purely discretionary. It will depend on the market being traded, the timeframe, and one’s personal preferences on the general quality of the signals.
On this particular daily chart of the S&P 500 (below), the settings are set to a 20-period simple moving average of the typical price and a 4x multiple on the average true range. This is a fairly strict setting. I can’t quantify the probability of price falling outside of this range. It will depend on the asset, charting timeframe, volatility, and perhaps other variables. But it’s certainly less than half a percent in this case.
There was only one case of the market breaking out of the channel from mid-April 2016 to early-October 2016. This occurred due to the UK’s vote to exit the European Union in late-June of that year.
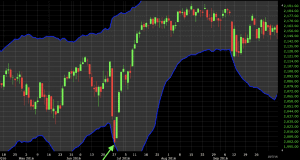
This produced a buy signal from the Keltner channels upon moving below the lower band. This also coincided with a touch of a psychological support level of 2,000 in this market.
Example #2
If we look further out on this same market, we see two or three additional signals (depending on if you add to positions on any subsequent touch on a different candle). All are short opportunities upon a touch and break of the top band.
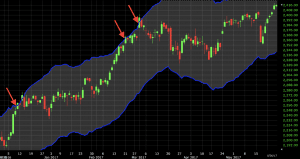
For those who are trend followers, they may have passed up these opportunities. And this, of course, is perfectly fine. Having discipline in one’s approach is extremely important. Whether these turned out to be winning trades depends on where they were exited. They could have produced solid winning trades or they could have produced losing trades if held onto for too long.
To exit, one could use a separate technical indicator. This could be MACD, Relative Strength Index, among many, many others. It could be candlestick patterns or areas of support and resistance on smaller timeframes. It could also be related to an opinion on the market according to fundamental analysis.
We can also, for example, plot a center line in the Keltner channel, and use this as a take-profit level. This is the moving average of the typical price over the period considered (in this case 20 periods). If we choose to go by this, in these cases, we see relatively small winning trades. (Trade exits are denoted by the white arrows.)
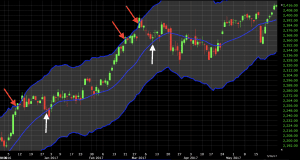
While trend followers may forgo these opportunities, taking short positions can be a way to hedge net-long exposure to stocks in other trades open on other indices or individual securities.
Conclusion
Keltner channels help gauge the level of volatility in a market and are fundamentally a price reversal indicator. The robustness of the signals will depend on the settings of the indicator. Price venturing outside of wider bands will tend to produce fewer but more reliable signals. Price moving outside of narrower bands will produce more frequent but less reliable signals.
Traders may further filter signals by taking trades only in the direction of the trend, through confirmation provided from other indicators, or based on a fundamental interpretation of the market.