Envelope Channel


The envelope channel, sometimes simply referred to as an “envelope”, is formed by two separate moving averages that are a defined percentage away from a moving average of price.
The Best Envelope Channel Analysis Brokers
-
1
 Interactive Brokers
 -
2
 NinjaTrader
 -
3
 eToro USAeToro USA LLC and eToro USA Securities Inc.; Investing involves risk, including loss of principal; Not a recommendation
 -
4
 Plus500USTrading in futures and options involves the risk of loss and is not suitable for everyone.
The resultant channel that’s formed represents upper and lower bound levels. Traders might interpret the area outside of the channel as where a market might be overbought or oversold.
The channel is most frequently overlaid on a price chart, which allows for visualization of where current price stands in relation. Price lying between the bands identifies a “normalized area”. Trade signals are generated when price moves outside of the channel.
Similar to Bollinger bands, how a trader interprets a move outside the bands is based on personal discretion. Some, for example, might interpret a move above the top band as a “breakout” – and therefore a reason to possibly go long. Others might see it differently and view price as being stretched or overbought and look for a sell/short opportunity.
Calculation of the Envelope Channel
The envelope channel involves the calculation of two moving averages (or three if one chooses to have a middle band) that are plus or minus n% away from a moving average of price. A simple moving average is defined as the average of the closing prices of the past X number of price bars. The moving averages can also be adjusted to the exponential and front weighted variants as well, which place greater weight on more current data relative to older data.
The top and bottom bands are calculated based on the high and low price inputs, respectively, of the past X number of price bars. These bands can be adjusted up or down with user defined input regarding the percentage deviation. The middle band, if one is chosen to be displayed, is simply the simple moving average of price.
“X” is user defined. A 50-period setting is the default on most charting software that include the indicator.
On some charting software, the envelope channel adjustment feature is defined as inputting the number of standard deviations (with a higher number producing wider bands and lower number producing narrower bands). But this is inaccurate. Envelope channels simply move the bands up or down by a certain percent. If standard deviation were the true input, then they would be the equivalent of Bollinger bands. The two are similar indicators, but different concepts.
Regardless, the envelope channel can be customized to meet the preferences of each individual trader.
Uses of the Envelope Channel
The envelope channel is more commonly interpreted as a “price reversal” indicator relative to Bollinger bands, its close comparable.
Bollinger bands are calculated using the standard deviation of a moving average, which makes it more responsive to volatility. The envelope channel uses a moving average of +n% and –n% away from the mean. This makes it less responsive to volatility and, as its name suggests, something closer to a true channel or fixed range that moves up and down with price.
The middle band, if plotted, is the same between both the Bollinger bands and envelope channel.
Bollinger bands are more commonly used as a trend-following indicator where a price move outside of the bands suggests a breakout in that direction. It is also commonly used as a way to visually gauge volatility, where tight bands depict low volatility and wide bands denote high volatility.
The envelope channel, however, is generally a better gauge of a potential price reversal. If the percentage deviation from the mean is set high enough, then naturally it’s expected that price will venture outside of that range only on rare occasions.
Moreover, when price makes the rapid moves that would necessitate moving outside of the channel, these moves are generally faded. Markets might be responding to news, and the initial move is often rash and overdone, leading to a reversal. Exceptions can and do occur, particularly when new information rapidly changes the pricing of a market. But no market remains exponential for elongated periods.
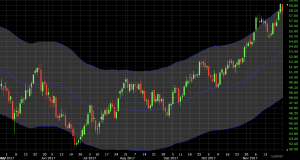
The image below shows Bollinger bands and the envelope channel on the same chart on the S&P 500. The Bollinger bands are represented by the larger cloud with green upper and lower bounds. The envelope channel is the smaller cloud mostly within the Bollinger bands represented by blue boundaries. It emphasizes the degree to which the Bollinger bands are more reactive to volatility while the envelope channel remains as a fixed range.
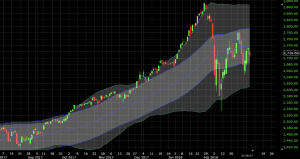
The disparity becomes more pronounced the more volatile the market. Consider the width of the Bollinger bands in relation to the envelope channel on WTI crude oil (roughly 2.5x the annualized volatility of US equities):
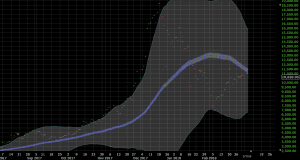
And especially with respect to bitcoin (about 20x the volatility of US equities):
So while traders will apply the envelope channel in different ways based upon unique interpretations, it is common for a sell signal to be issued once price touches the upper band (“overbought”). Likewise, a buy signal might be interpreted once prices touches the lower band (“oversold”).
Given price is likely to stay within the band a certain percentage of the time, this gives the idea of a price reversal signal legitimacy. The extent to which this is true is dependent on the width of the envelope. The larger the envelope is made, the longer price will stay within it. Larger envelope channels decrease the frequency of the signals, but will tend to increase their accuracy (because the probability that they venture outside the band is less likely to begin with). It is up to the trader utilizing this indicator to get the balance between the two correct.
Trade Examples of the Envelope Channel
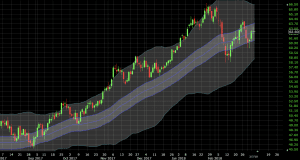
EUR/USD Daily Chart
After the 2016 US presidential election, there was a shake-up in many asset classes. The US dollar gained strength, which caused the EUR/USD to decline.
Unless your settings on the envelope channel were highly conservative (wide bands), you likely would have seen at least one signal on this move. You ended up getting two in late November.
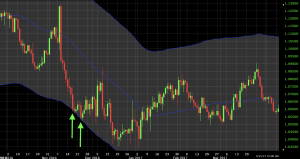
Of course, once you enter into a trade there’s always the question of where to get out, and it’s equally important. This depends on the trader. One could use the following:
- A touch of the middle band as an indication to exit the trade, under the idea that price has normalized and is no longer “out of whack”.
- Candlestick patterns that suggest the direction of the trade could go against you in the future (e.g., doji candle, engulfing pattern).
- Support or resistance level where orders are likely to be congested and cause momentum to stall.
- Dictated by another indicator altogether.
Price reversal trades can be risky given that they essentially run counter to the prevailing trend. Trends are often in place for a reason. The long-term directional macroeconomic trends often observed in financial markets can be due to central banks buying financial assets, carry-related where one a low-yielding currency is borrowed in order to invest in a higher-yielding currency, ongoing equilibration of supply and demand, and numerous other reasons.
One would have also seen two additional signals later on in this market.
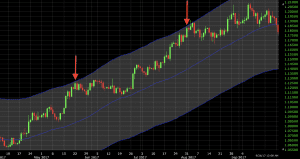
These would have worked out, but only as temporary breaks in the trend. As noted, fighting the trend can be difficult and must be treaded carefully.
We also have 2-3 more signals.
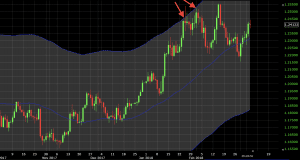
These appear to be mildly profitable depending on how the exit was planned. One could have taken profit off the doji candles or upon a touch of the middle band of the channel, as suggested above.
Conclusion
The envelope channel is a price reversal indicator designed to diagnose when price is becoming stretched. The wider the band, the less frequent the signals will be. But they will tend to be more reliable. It’s better to opt on the side of going “too wide” rather than “too narrow” as the latter will produce far too many unreliable signals.
The envelope channel can be applied to any timeframe, but its settings will need to be changed based on the asset being traded and one’s time horizon.
The more volatile the asset and the higher the timeframe, the wider the channel will need to be set in order to generate quality price reversal signals.
For example, for someone trading off the hourly chart and planning to hold positions for days (instead of weeks, months, or even years), the envelope channel should be reduced by a proportionate width relative to what it might be if trading predominantly off the daily chart.
Likewise, if trading primarily off the weekly chart, one should increase the width relative to someone trading off a smaller timeframe. What this adjustment might be depends on the market being traded. Moreover, it should be backtested such that it’s been found to give credible signals historically.