Commodity Channel Index (CCI)


The commodity channel index (CCI) is used to define new trends or cyclical conditions, by relating the deviation of an asset’s value to its statistical average.
Developed in 1980, the CCI was originally designed for trading commodities, an inherently cyclical asset class, but has since become widely applied to all asset classes.
The Best Brokers For CCI Trading

Mathematical Definition of the Commodity Channel Index
The commodity channel index measures an asset value’s deviation from its statistical average. It is calculated by taking the “typical price” (TP) of the commodity, subtracting the value of its simple moving average from the same period (i.e., average typical price, or ATP), and then dividing this value by the mean absolute deviation (MAD) of the typical price.
To make the values of the CCI more readable, it is multiplied by 66.67 (or 1/0.015). This allows about 75% of the values to fall between +100 and -100.
Commodity Channel Index (CCI) = (TP – ATP) / (0.015 x MAD)
The typical price is defined as the sum of its high, low, and close price during any given period divided by three.
Mean absolute deviation is a way to find variation in a set of data, defined as the average distance between each data point and the mean of the data set.
Interpretation of the CCI
As an oscillator, the commodity channel index is used to identify trend strength and extremes in price. How traders identify this is, naturally, up to the analyst. Some may interpret price extremes when the CCI is outside of the +100 to -100 bound and thus look for price reversals in those areas.
Another trader, however, might interpret a CCI of above +100 to be a breakout indication and decide to trade with the trend until the CCI runs back below +100. Likewise, a CCI below -100 could be interpreted as a robust downtrend, and a signal to take a short position.
Below is a weekly chart of WTI oil where we see a few instances of the CCI above +100 and below -100. Areas marked off with vertical lines denote these instances. The first vertical white line indicates the start of a hypothetical trade and the vertical line following denotes the end of it.
For a trader who interprets the CCI as something closer to a pure oscillator – and thus a price reversal indicator – we might see trades opposite the direction of the indicator. Namely, a potential signal to go short could be generated when the CCI is above +100 and a long trade signal when the CCI is above -100. A trader who sees the CCI as a breakout/trend following indicator might be biased toward long trades in greater than +100 CCI circumstances and short trades in less than -100 CCI conditions.
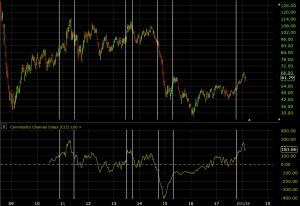
All four wouldn’t have panned out for the price reversal trader. If one backtested this particular strategy as such, one would see that its validity is low. One could either tighten up the strategy to produce signals at greater than +150 or below -150 or even above/below +200/-200.
For someone using the CCI for trend following, it appears to work effectively and would ideally be tested over multiple assets, market conditions, and potentially multiple timeframes as well.
Use With Other Indicators
When used in tandem with other indicators or oscillators, the commodity channel index can provide a useful addition to identify potential price extremes and turning points.
For example, if we pair the Aroon oscillator with the CCI, we can generate trade signals in the direction of the prevailing trend when both simultaneously confirm.
Let’s say we use the following criteria for a trade signal on a weekly chart of oil:
- CCI (100-period) of greater than +100 for buy/long signals or less than -100 for short/sell signals
- Aroon oscillator of greater than +75 for buy/long signals or less than -75 for short/sell signals
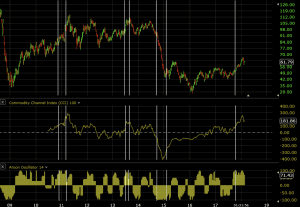
The first two trades under these conditions would have been buys; the third would have been a sell; and the final one would be a buy trade that’s still open.
Shortcomings and Limitations
No indicator should be used in isolation. All indicators that mathematically transform price and volume data fundamentally lag price itself given so much previous data is wrapped up in them. The CCI should ideally be used with other forms of technical analysis and/or fundamental analysis.
The CCI essentially tells you that the price of an asset may be out of line relative to its historical average, but there may be legitimate fundamental reasons why this is the case. Sometimes the valuations of certain securities – and occasionally indices or entire asset classes – undergo very rapid and justifiable changes.
The CCI, if used as a price reversal indicator, may interpret this change as an unsustainable move. But asset prices are not always mean reverting.
If and when more market participants catch on to the idea of a market moving in a particular direction, this will tend to produce a trend. This is why trend following is such a common aspect of technical analysis.
The CCI, as a momentum-based oscillator, falls into a different category. Instead of readings above +100 being seen as “overbought” they might be considered an indication that an up-move has plenty of buying behind it and could run further.
While levels above +100 and below -100 may indicate “overbought” and “oversold” conditions, respectively, it’s not a reliable signal that price will return back to more normative levels. Roughly 75% of the CCI’s readings will be within these particular readings, meaning approximately only 25% of the time will it give off a potential trade signal. Given the uncertainty of whether these levels represent breakouts or price extremes, producing signals with other indicators is preferred.