Aroon Oscillator


The Aroon oscillator uses parts of the Aroon indicator to determine the strength of a trend and the probability of it continuing. The oscillator works by taking the “Aroon up” indicator and subtracting “Aroon down”. Aroon up measures the value of the uptrend while Aroon down measures the value of the downtrend.
Top Recommended Brokers For Trading With The Aroon Indicator

- “Aroon up” is calculated as the following:
((number of periods) – (number of periods since highest high)) / (number of periods) x 100
Translated, it calculates the time that it’s taken since price reached its latest high, and expresses it as a percentage.
- “Aroon down” is calculated as:
((number of periods) – (number of periods since lowest low)) / (number of periods) x 100
Naturally, “Aroon down” calculates the converse – the time it’s taken since price reached its latest low.
So if the oscillator’s period is set to 14 (price data of the past 14 candlesticks included in the indicator’s calculation) and the most recent high was seven candles (i.e., periods) ago, the value of “Aroon up” would be 50 [(14 – 7) / 14 * 100].
If the most recent low was three candles ago, the value of “Aroon down” would be 79 [(14 – 3) / 14 * 100].
That would in turn give the Aroon oscillator a value of -29 (50 – 79).
Interpretation
With the Aroon oscillator, a value above zero denotes a current uptrend, while a value below zero indicates a current downtrend. A cross above the zero line may denote the beginning of a new uptrend while a cross below the zero line may indicate the beginning of a new downtrend.
The Aroon oscillator is typically displayed as a bar chart distribution. Levels ranging from +40 to -40 (on a +100 to -100 scale) may denote a consolidating market with no particular strong trend either way.
Aroon Oscillator Examples
Example #1
The standard setting for the Aroon oscillator’s period is 14 (uses price data from the past 14 candlesticks).
Here we see an hourly chart of the S&P 500 using the Aroon oscillator’s period set to 14:
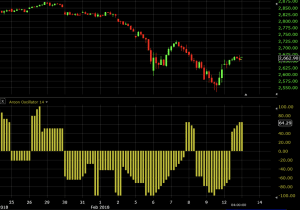
This is an example of a setting that might be appropriate for a day trader. The Aroon oscillator helps inform a trader of the prevailing trend (if one exists) and its magnitude. For those using trend-following strategies they might take this information into account when evaluating trade opportunities.
Example 2
Below we see an example of a weekly chart of the S&P 500 using the Aroon oscillator’s period set to 200:
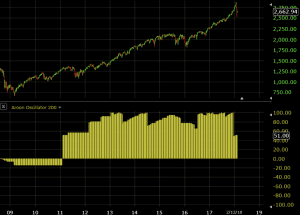
This would be most appropriate for someone with a longer-term perspective, perhaps a retiree focused on holding positions long-term.
By setting the period to 200, we encapsulate trend-related data from the past 200 weeks. This means that the downtrend from the financial crisis would have lasted until 2011. The uptrend has been strong through the early part of 2018 (topping out at +100 on several occasions) before settling back at +50 after the early February correction in stocks.
Example 3
For those with a very long time horizon and a trend-following strategy, the Aroon oscillator may suggest continuing to be long stocks.
Here is a 15-minute chart of the S&P 500 using the Aroon oscillator set to 200:
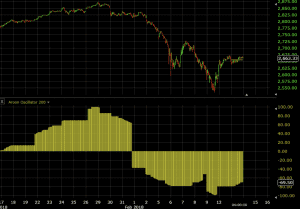
This setting, using trend data over the past two hundred 15-minute periods (i.e., past 50 hours over which the asset has traded), is most relevant for traders who plan to hold positions for days or up to a few weeks.
The Aroon oscillator in this case does a pretty good job of identifying trends ahead of time. It correctly caught the uptrend in stocks from mid-January to late-January 2018 and accurately predicted a deceleration and reversal of the trend before the early-February 2018 correction.
Conclusion
The Aroon oscillator, like any technical indicator, should be used as a complement, rather than a substitute, for conducting technical analysis primarily via the price chart. The Aroon oscillator can help in identifying trends but shouldn’t be used to trade in isolation.
Its setting should be adjusted relative to one’s planned trading horizon and the time compression of the chart one primarily reads off of (e.g., 5-minute, 30-minute, daily, etc.).
Those trading off the daily chart, who plan to hold positions for months, should probably set the setting to 25 or above. Traders trading off the 5-minute chart and plan to hold position intraday only, should set it to around the default setting of 14. Setting the period too low will result in excessive noise as it compresses the range of possible value readings.