Aroon


The Aroon indicator helps traders identify whether price is trending or range-bound. Using its two components, “Aroon up” and “Aroon down”, it is designed to show the beginning of a new trend, its magnitude, and changes from range-bound behavior to trending patterns and vice versa.
The Best Brokers For Aroon Trading

- “Aroon up” is calculated as follows:
((number of periods) – (number of periods since highest high)) / (number of periods) x 100
In other words, it calculates the time that it’s taken since price reached its latest high, and expresses it as a percentage.
- “Aroon down” is calculated as:
((number of periods) – (number of periods since lowest low)) / (number of periods) x 100
Naturally, “Aroon down” calculates the converse – the time it’s taken since price reached its latest low.
Interpretation
If one is to use the Aroon indicator as part of a trend-following strategy, the primary assumption inherent in the idea is that a security or index will close at new highs in an uptrend and new lows in a downtrend.
The Aroon is based on a 0-100 scale. Fifty (50) is the midpoint of the indicator.
If the Aroon’s period is set to 60 (the number of candles it takes into account) and the “Aroon up” is at 50, this would indicate that the latest high of the past 60 periods (as represented by the number of candles) was 30 periods ago.
If the Aroon’s period is set to 60 and the “Aroon down” is at 75, this means that the most recent low was 15 periods ago.
How to Implement and Use the Aroon Indicator
It’s important to note that “highest high” and “lowest low” inputs are not necessarily relative to the asset’s entire history, just relative to the highest and lowest prices over a user-defined period (all prices before this input are ignored).
For example, if we use a 60-day Aroon indicator on the S&P 500 – i.e., daily chart of the index with the Aroon set to a period of 60 – we see the following:
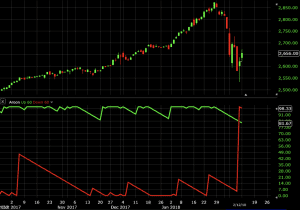
This tells us that the uptrend is still strong (approximately 82 on the 100-scale) over this period but declining from its recent strength. The downtrend is, however, near the strongest it’s been (approximately 98). This would tell us that we can’t make strong determinations about the trend either way.
If we shorten this to a period of 14, which is often the default setting, we produce the following:
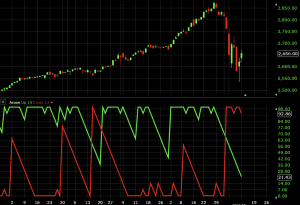
Here, due to the recent action displayed in the chart – a large bout of volatility relative to the previous period – it shows the downtrend as being very strong relative to the uptrend. This simply means that for those using trend-following systems, one might be biased in favor of shorting the index over going long due to recent weakness. But it is, of course, very much open to the interpretation of the trader.
Overall, the shorter the period, the more the indicator will move around as less data is included and the range of possible values declines.
How to set the period of the Aroon largely depends on your trading style.
Longer-term traders should naturally set it to longer time periods. Shorter-term day traders should set it to either short-term (to reflect their trading style) or longer-term to stay abreast of the long-term trend.
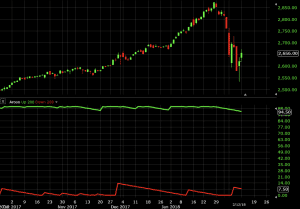
A longer-term trader who expects to hold positions for months, if not years, and trades off the daily chart might set the Aroon’s period to 200 (below). For the S&P 500 over the timeframe studied, the Aroon would thereby show a clear uptrend and orient the technically minded trend-following trader toward long trades (i.e., expecting the index to further appreciate).
Conclusion
The Aroon indicator is very similar to a moving average but with a specialized focus on the time since the most recent high or low. It is primarily used by those who use a trend-following strategy.
How a trader uses the Aroon should be predicated on the timeframe one trades or to gain a better understanding of the overall trend. A shorter-term trader is likely to use a shorter period, but not so short that it generates too much noise (e.g., period below the 8-10 range).
It’s also perfectly viable for day traders to use it to track longer-term trends. For example, a day trader using a 5-minute chart on a 24/5 asset (like forex and many commodities) who want to use the Aroon to view the trend over the past day could set the period all the way up to 288, or roughly the number of five-minute periods in the past day in which the asset traded.