Ease of Movement


Ease of movement is a momentum indicator that demonstrates the relationship between the rate of change in an asset’s price and its volume. It is intended for the daily chart and larger timeframes.
The Best Brokers For Trading With Ease Of Movement Analysis
-
1
 Interactive Brokers
 -
2
 NinjaTrader
 -
3
 eToro USAeToro USA LLC and eToro USA Securities Inc.; Investing involves risk, including loss of principal; Not a recommendation
 -
4
 Plus500USTrading in futures and options involves the risk of loss and is not suitable for everyone.
As its name implies, the larger the magnitude of the indicator – the “easier” the movement in price – the more robust the trend is believed to be.
A larger positive value indicates price moving upward on disproportionately low volume. Conversely, a larger negative value indicates price moving downward on disproportionately low volume. Accordingly, ease of movement is used to obtain a sense of how much volume is needed to cause price movement.
An indicator value of greater than zero denotes that the asset is being bought (or “accumulated” in technical analysis lingo). A value of less than zero generally denotes that the asset is being sold (“distributed”).
Calculation of the Ease of Movement Indicator
Ease of movement is calculated in three steps. First, is the difference taken between the security’s high-to-low range. Then we measure the price movement for any given period, followed by the change in volume over the course of that period. Finally, we calculate price movement relative to volume and form a moving average by taking into account several data points.
Distance is calculated by using current price inputs versus previous price inputs.
Distance = (High + Low) / 2 – (Previous High + Previous Low) / 2
Volume and the current high-to-low range are used to obtain what’s called the box ratio, calculated as:
Box Ratio = (Volume / X) / (High – Low)
Where:
X = Some integer factor used to help produce a “normal” number for the ratio that’s not too big or too small. Often somewhere in the 1,000,000 to 100,000,000 range to account for the number of shares traded in any given day.
A single-period ease of movement is calculated by taking the distance computed in the first step and dividing by the box ratio, as follows:
Single-Period Ease of Movement = Distance / Box Ratio
Ease of movement, however, is formed via the same concept behind a moving average. Namely, various single-period ease of movements are added together and divided by the number of periods considered.
This helps to smooth the indicator over time, simplify the process of identifying trends, and find areas of convergence or divergence. (An area of convergence pertains to price running one way and ease of movement moving in the same direction after some previous time apart. An area of divergence pertains to price and the indicator running opposite each other.)
How to Use the Ease of Movement Indicator
Example #1
Some traders use a break above or below the zero line in order to enter into a trade. Above zero readings are bullish and therefore a potential indication to enter into a buy/long trade. Below zero readings are bearish and therefore a potential indication to enter into a sell/short trade.
To avoid false signals, traders might prefer to only take trades where the indicator is a certain threshold above the zero line. In certain consolidating markets, the indicator will frequently pass above and below zero.
For example, on the daily chart of the S&P 500, one might choose to only go long once the ease of movement indicator runs above 10,000. Similarly, they may also only go short once the indicators runs below -10,000. What this particular level is will be dependent on the asset itself.
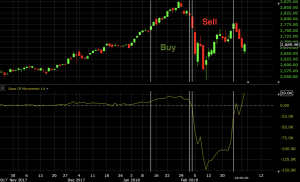
Between the first two vertical white lines represents a buy/long signal with the indicator above 10,000 and closed out once back below 10,000. The second pair of vertical white lines represents a sell/short signal with the indicator below -10,000 and closed out once back above -10,000.
Example #2
Ease of movement can also be used to confirm other indicators.
For example, if one is using a breakout above or below the Bollinger bands as a trade signal, the signal may be confirmed by observing that ease of movement is also above or below zero in the relevant direction. An exit from the trade could include either a break down below zero (or some specified level) on the ease of movement or, for instance, a touch of the middle band on the Bollinger bands.
For example:
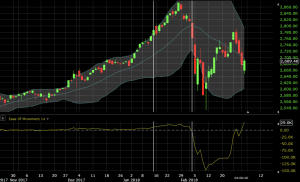
The first vertical white line indicates the entry point while the second line denotes the exit point of the trade.
We can also see from this chart that the strength of the downtrend – as denoted by the ease of movement – is much greater than previous uptrend. Qualitatively, a trader might interpret this as selling pressure being much more formidable than buyers’ ability to prop up the market. Accordingly, he or she could look to cut their long positions in this market or stay out of it altogether.
Conclusion
The ease of movement indicator is designed to track price as it relates to volume.
A more positive value denotes a stronger uptrend, as evidenced by a greater positive change in price relative to volume. Likewise, a greater negative value illustrates a stronger downtrend, as denoted by price falling an amount greater than the rise in volume.
If traders realize that price is moving in one direction more easily – i.e., each unit of volume carries price further in one direction relative to another – they might be biased toward trading in that particular direction. If the indicator is above zero, this might be interpreted as a bullish signal. It might be interpreted as a bearish signal if the indicator is below zero.
Like all indicators, the ease of movement should not be used in isolation. It should be used to confirm other indicator tools or as part of a broader system where multiple indicators line up at once.