Donchian Channels


Donchian channels is an indicator used to assess the volatility of a market. It takes the highest high and lowest low of the previous X periods (X is user-defined, but generally set at a default of 50). The difference between these two points constitutes the channel over this period.
The Best Brokers For Donchian Channels Trading
-
1
 Interactive Brokers
 -
2
 NinjaTrader
 -
3
 eToro USAeToro USA LLC and eToro USA Securities Inc.; Investing involves risk, including loss of principal; Not a recommendation
 -
4
 Plus500USTrading in futures and options involves the risk of loss and is not suitable for everyone.
On charting software, Donchian channels are placed over the price chart to help traders visualize where current price is relative to the upper and lower bounds of the channel. A middle line can also be added to provide the midpoint between the channels (not shown below).
If we use a 50-period setting, the indicator would appear as follows:
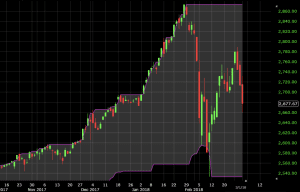
(Daily chart of the S&P 500)
Over the recent timeframe, the market set recent 50-day highs and lows. The Donchian channels reflect this by displaying a range between these points.
In general, the shorter the period, the more compressed the channels will be. Larger data sets will tend to produce broader ranges.
Uses of the Donchian Channels
If prices are more stable, then Donchian channels will be relatively tight. If prices are less stable, then the channels will be wider.
How a trader uses this information will be dependent on the broader strategy. Most traders use directional strategies and thus rely on volatility to an extent in order to generate profit.
Some traders also choose to take advantage of quieter market environments by employing certain strategies that can work if volatility remains contained. (These can include, for example, calendar spreads or buying an in-the-money call option and in-the-money put option such that profit is maximized if the asset’s movement remains range-bound.)
Donchian channels can also be used to enter directional trades on their own. For example, if price breaks above its X period high, then one might interpret that as a long trade being established. Contrarily, if price breaks below its X period low, then this might be interpreted as a signal for a short trade.
An exit signal can be generated using a touch of the midpoint line – which can be added by adjusting the settings – or through a signal using a different indicator.
This inherently makes the Donchian channels a trend-following indicator if interpreted in this manner.
Example
If we look again at a daily chart of the S&P 500, we can see that if we use a 50-day period for the Donchian channels using the rules displayed above (long trade if there’s a close above the channel, with a closing of the trade when touching the midpoint line), we see two setups within the past nine months.
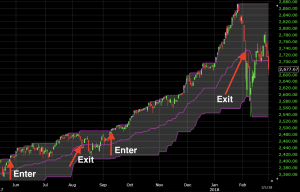
The first was a moderate winner, with the second a big winner.
Donchian channels can of course be used on smaller time compressions, such as the hourly chart, 15-minute chart, 5-minute chart, and anything in between.
The smaller the time compression and lower the period of the channels, the more frequent the signals will be. (That is, of course, assuming trade signals are generated based off price closing above and below the channels.) But note that more frequent signals do not necessarily equate to more trading profit.
Conclusion
Donchian channels measure price volatility and historical price extremes. It’s plotted based on the highest highs and lowest lows over a specific number of periods.
Long trades are typically taken at a break above the top band and short trades are taken at a break below the bottom band. Trade exits are generally signaled through a separate indicator or through a touch of the midpoint line that can be added to it.