Chaikin Money Flow


Chaikin Money Flow is a measure of momentum under the idea held by many market technicians that price follows volume. Fundamentally, it is a money flow oscillator similar to the MACD indicator.
The indicator runs both above and below zero, made to denote whether an asset is in a bullish (above zero) or bearish (below zero) trend. Chaikin Money Flow is not made to be used as an isolated trading system, but rather as a tool to help traders identify trends.
Top Brokers For Chaikin Money Flow Trading


Calculation of the Chaikin Money Flow Indicator
The Chaikin Money Flow is calculated in two steps.
First it takes a money flow calculation, using high, low, and close prices in addition to volume. This is usually done at the daily level, but can also be done for other time compressions (e.g., 15-minute, hourly, weekly).
Then it takes the average of these money flow calculations over the past certain number of periods. The default number of periods for the Chaikin Money Flow is 21 given it’s most commonly applied to the daily chart. Twenty-one trading days would then encapsulate the past month of price data.
- Daily Money Flow = [(Close – Low) – (High – Close) / (High – Low)] * Volume
- Chaikin Money Flow = 21-Day Average of Daily Money Flow / 21-Day Average of Volume
The indicator is available on most trading software platforms. It is commonly expressed as a decimal rather than a value between 0-100, but is not standardized. A value of .51 may be the same as a value of 51 on another charting platform; likewise, a value of -0.07 could mean -7 elsewhere.
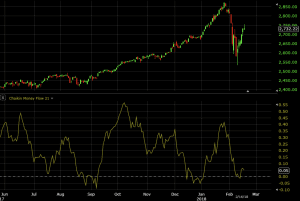
In an uptrending market, the indicator will accordingly produce mostly positive values. The below example shows a daily chart of the S&P 500 with the Chaikin Money Flow set to a standard 21-period.
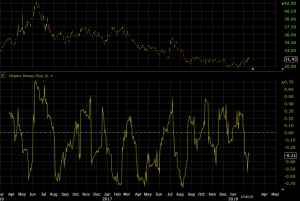
The indicator can also be very choppy for more volatile assets, such as the exchange-traded fund (ETF) that mirrors the return of the Dow Jones-UBS Agriculture Subindex Total Return index (ticker symbol: JJA on the NYSE Arca).
How to Use the Chaikin Money Flow
The Chaikin Money Flow should ideally be used in conjunction with a price chart and, if one so chooses, other indicators. It is predominantly used to confirm trending or breakout price behavior rather than elicit trade signals on its own.
The period of the CMF should be customized to each individual trader’s preferences. The 21-period default is more oriented toward shorter-term traders. This setting is most useful for those looking to capture shorter-term trends relative to the charting timeframe.
A 63-, 126-, or 252-day period would be more applicable for those looking at intermediate- and longer-term trends. However, the longer the time period, the longer it will take for new price trends to emerge because so much previous data is taken into account. Changes in the CMF are just as likely to be from old data dropping out from new data coming in.
For short-term traders, applying a 24-period CMF on a 5-minute chart would provide two hours of trend/momentum data.
Chaikin Money Flow + Moving Average Strategy
Given the CMF is not recommended as a standalone system, it is often used in conjunction with (an)other indicator(s) or price alone. The moving average is commonly paired with the CMF as a trend confirmation tool.
Namely, one rules-based approach suggests that trades be taken in the direction of the trend – as dictated by the CMF – on pullbacks to a moving average (common settings for the moving average include 21-, 50-, 100-, and 200-period).
Consider the following daily chart of the S&P 500:
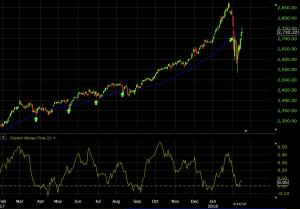
Where each green “up” arrow is planted, the following criteria are matched:
- The CMF is greater than 0 (price is in an uptrend)
- The 50-day simple moving average (SMA) is positively sloped (further confirmation of an uptrend)
- A long/buy trade is taken on a pullback to the 50 SMA
An exit from the trade can entail reaching one’s personal take-profit level, when the CMF runs below 0, when the SMA becomes negatively sloped, a touch of a particular support or resistance line, a certain candlestick pattern (e.g., bearish engulfing candle), among potential other reasons either technically or fundamentally based.
Likewise, trade exit signals would be the opposite for short trades (e.g., CMF running above 0, positively sloped SMA).
Stop-losses can either be set at a support or resistance level, which is common among technical traders. They can also be set as a percentage of price. For short-term traders, stop-losses at 2%-3% of price are common. For long-term swing traders, who might hold positions over weeks, months, or possibly even years, stop-losses of 5%-10%+ are more typical.
Chaikin Money Flow + Support/Resistance Strategy
A common CMF strategy is to use it alongside support and resistance levels to take breakouts in the direction of the trend (as confirmed by the CMF). Examples from the same chart as above (daily time compression of the S&P 500) can be found below:
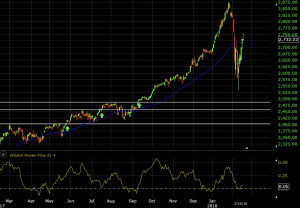
In each case the following are supported:
- The CMF is greater than 0 (price is in an uptrend)
- Price breaks out above resistance, with a close above the line
- The 50-day simple moving average (SMA) is positively sloped (further confirmation of an uptrend)
Similarly, as above, stop-losses can be placed either at points of congestion in the market (support or resistance levels) or as a percentage of price, which will be lower for shorter-term traders and higher for longer-term traders. Those using the CMF as a confirmation tool may also exit when it breaches a certain threshold, such as zero, denoting a trend change from bullish to bearish or vice versa.
Uses and Shortcomings
The CMF should ideally be used to confirm trends or gauge their strength. As a trade system in itself, as a lagging indicator, it won’t function very well.
The shorter the period is set, the more current data will impact its value. This makes the indicator more “current”, but more prone to wild swings in its value. Contrarily, the longer a period is set, the smoother the trend will appear, but old data will dominate the value of the CMF relative to new data.
The CMF, as abovementioned, is also not an indicator that can provide insight into stop-loss or take-profit levels. It can, however, be taken as a signal to exit out of trades if the trend turns (according to its indication) or breaches a certain level of interest to the trader (e.g., falls below 0.20, or a sign that the trend is losing strength).
Conclusion
The CMF is a trend strength indicator dictated by price and volume data. A positive value is intended to denote an uptrend over the specified period while a negative value is interpreted as a downtrend.
If the CMF itself is in an uptrend (the slope of the line, not its value) this is interpreted as the asset being accumulated (bought). Contrarily, if the CMF is in a downtrend, this may be interpreted as the asset being distributed (sold).
The indicator should ideally be used to encompass a period that is relevant to your trading timeframe. While the CMF has traditionally been used in a 21-period setting on a daily chart, this will not be optimal for day traders who primarily trade from the 5-minute to hourly chart.
For those trading from the 5-minute chart, a 36-period CMF would interpret the trend from the previous three hours of price data; a 96-period CMF would capture the trend of the past eight hours.
Those who use the hourly/60-minute chart typically hold positions over the course of days, rather than intra-day only. In this case, a 24-period CMF would give the trend over the past day (for 24/5 markets, like forex), with a 120-period CMF giving the trend over the past week.
Stop-loss and take-profit levels are not something the CMF provides. These must be determined through alternative indicators or in accordance with the trader’s own risk limitations. Exits may nonetheless be determined through a particular shift in the CMF, such as a change in its value from positive to negative or vice versa.