Detrended Price Oscillator


The detrended price oscillator seeks to filter out long-term trends from price data to isolate and highlight short-term price cycles and potential overbought/oversold levels. It is different from momentum indicators, such as the MACD or the various “overbought” / “oversold” oscillator indicators.
The Best Brokers For Detrended Price Oscillator Analysis

Calculation of the Detrended Price Oscillator
The detrended price oscillator is calculated by taking the price of the asset (X/2 + 1) periods ago and subtracting an X-period simple moving average.
The default setting on the indicator is generally 21 periods. This is common for many indicators given the daily chart is the most common charting timeframe and there are approximately 21 trading days per month. This means roughly one month of data is wrapped up in the calculation of the indicator.
So if a 21-period setting is applied to the daily chart the detrended price indicator would be equal to:
The price (21/2 + 1 = 11.5) periods ago minus a 21-period simple moving average.
Of course, the period is up to the personal discretion of the trader. For those who trade off the daily chart, the 21-period default would be sufficient for those who are in trades for weeks or months. Those who plan to be in trades for even longer might set the period to perhaps 50 periods, 100 periods, or higher.
For those who trade off smaller time compressions (e.g., 15-minute chart, hourly chart), and trade actively, the period could be set as low as 10 periods. A 10-period detrended price oscillator may give multiple trading signals per day. Note that there isn’t any correlation between a higher quantity of trading signals with higher profitability.
Examples
Example #1: Stock Index
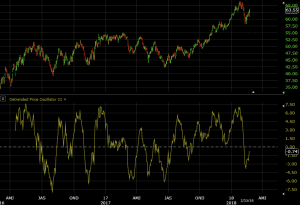
Below is a 21-period detrended price oscillator applied to a daily chart of the S&P 500.
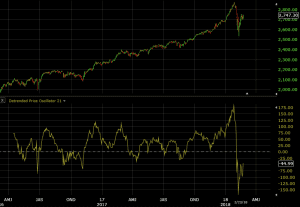
Going based on a simple eye test, the indicator seems to predict price history fairly accurately. However, this uses the benefit of hindsight. It’s not clear that there’s been a top or bottom until price starts moving in the opposite direction.
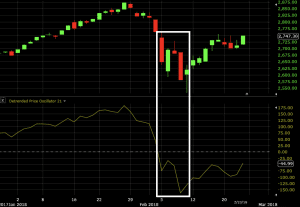
For example, if we look at the most recent price action, it’s not clear that a reversal is in store until price begins shifting in the other direction. If we look at the February 5-9 period, for instance (highlighted), it might initially appear that February 5 is a bottom after a green candle the following day. However, as we see, price declined over the next two days before forming a bottom on the 8th.
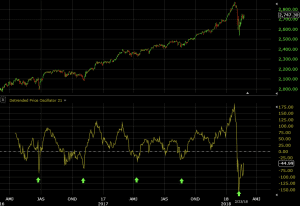
What it can do, however, is help one understand the cyclicality of certain assets. In the case of the S&P 500, the detrended price oscillator suggests that based on this timeframe and periodicity setting, we tend to see price weakness in the index every 4-5 months (each vertical gridline is spaced three months apart).
Example #2: Individual Stock
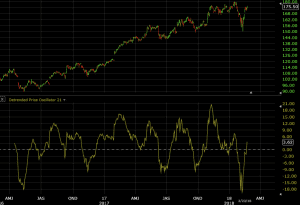
Below is a daily chart of Apple (AAPL) stock.
The important message from the detrended price oscillator is the frequency of the cyclicality in the stock’s price. It takes the stock roughly two months to oscillate between periods of highs and lows, or 4-5 months between cyclical high to high, or between cyclical low to low, similar to the S&P 500.
How would one take advantage of this information?
For long-term “buy and hold” investors, one might look to accumulate the stock on every point of weakness to improve the cost basis of their investment. Value investors – or those looking to exploit inefficiencies in the prices of securities – may find this information useful.
For traders, they may look to anticipate asset price cyclicality to make both long trades in anticipation of a cyclical bottom and short trades in anticipation of a cyclical top. Many stock traders may nonetheless ignore attempting to short certain stocks given their expected returns are positive over time. (Namely, the stock underlies a cash-producing company or at least one expected to generate cash in the future. A stock of a company wouldn’t have any value if this wasn’t the case.)
Example #3: Currency
Here we have a daily chart of the EUR/USD:
With this particular currency pair, peaks and troughs tend to occur every 1-2 months, but the cycle is jagged and uneven. This doesn’t necessarily mean that the detrended price oscillator couldn’t be useful in this case. But it could suggest that the indicator could best be utilized a different way.
For example, we can see that price extremes above +0.04 and below -0.04 don’t last for elongated durations. Nevertheless, these shouldn’t constitute price signals in themselves.
Ideally, any identification of price cyclicality or extremes – and any trading based off these – should be used in conjunction with other indicators. This can include price itself or other forms of analysis (such as a fundamental-based understanding of the asset).
Example #4: Commodity
Below is a 21-period detrended price oscillator applied to WTI crude oil:
Oil is more volatile than both stocks and developed market currencies. Therefore, it’s expected than any cyclical price behavior from the daily chart – as picked up by a metric that measures the difference between the price of oil 11-12 days ago and a 21-day simple moving average – would move faster.
Here we see peaks and troughs in the indicator roughly once per month. This compares to only every two months in certain stocks (though this naturally depends on the stock).
Cyclicality can be created from numerous factors, such as the following (though by no means an exclusive list):
- The ebb and flow of credit (these generally occur over the course of several years, not months)
- Seasonality (e.g., greater demand for natural gas during the winter months, higher retail sales in November and December in preparation for the holiday season)
- Product-based cycles
- Periodic earnings announcements or company operating/financial updates
Similar to the EUR/USD daily chart, traders could also look at the detrended price oscillator in terms of price extremes. On the daily chart, the indicator rarely stays above or below +/- 7.00 for long periods. (This is equal to the difference between the price 11.5 days ago and the 21-day simple moving average.)
Once price runs in one direction by a certain amount, it may be considered “overdone”. But these types of calls should never be made in isolation. Namely, other indicators should help determine whether price might be “running out steam” (e.g., stochastic oscillator, support and resistance lines).
Conclusion
The detrended price oscillator is calculated as the difference between the price of the asset at some point in the past relative to the current reading of a simple moving average of the asset. The idea is that price should converge to the moving average over time. This makes the detrended price oscillator cyclical in nature.
In hindsight, looking at the indicator relative to the price chart gives the impression that it does a good job of signaling tops and bottoms. However, price generally needs to make a top or bottom for the indicator to do the same thing. Therefore, the indicator isn’t quite as effective in predicting these moves as it seems.
One can use the detrended price oscillator to gauge cyclicality in an asset. If this occurs in regular intervals, it might be interpreted that these cycles can be predicted and therefore traded profitably. This may be more relevant for some assets relative to others.
Volatile assets are more likely to see faster movement in the detrended price oscillator than less volatile assets. Whether this has predictive value is another story and can go on an asset by asset basis.
The detrended price oscillator can also be used to identify price extremes. When it’s rare for price to venture outside a certain bound historically, this can signal that price is becoming stretched and could be ripe for normalization. This could mean a reversal or consolidation.
However, this can’t be relied upon in isolation, as there could be fundamental reasons why price is moving strongly in one direction or another. The detrended price oscillator should ideally be used in tandem with other indicators and at least rudimentary knowledge of the asset’s fundamental picture.