Coppock Curve


The Coppock curve is intended as a long-term forecasting tool to find trending securities and generate buy signals. It was originally published by E.S.C. Coppock in Barron’s Magazine in 1962.
The indicator is trend following in nature. Given it’s mathematically calculated as a weighted moving average, it is not designed to pick bottoms. The Coppock curve was developed to pick trending stocks and thus, by initial design, generates buy signals only.
Top Brokers For Coppock Curve Trading


Calculation of the Coppock Curve
The Coppock curve is calculated as a 10-period moving average of the sum of the 11-month rate of change and 14-month rate of change:
Coppock Curve = Weighted moving average (10) of (11-month ROC + 14-month ROC)
The rate of change, as defined in technical analysis, is the difference between the closing price today and the closing price X periods ago, with that figure divided by the closing price X periods ago:
Rate of change = [Closing Price (today) – Closing Price (X periods ago)] / Closing Price (X periods ago)
The numerator, [Closing Price (today) – Closing Price (X periods ago)], is also the definition of momentum, or how fast price is rising relative to another period.
The weighted moving average takes the past ten calculations of the sum of the 11-month and 14-month rate of change. A weighted moving average has the function of giving greater weight to more recent data over older data. The weights on older data decrease step-wise, or arithmetically. This differs from exponential moving averages, where the weights on older data decrease exponentially.
The choice of 11- and 14-month periods for the rate of change calculations may seem arbitrary, and that’s because they basically are. The indicator’s developer believed bear markets were psychologically similar to periods of mourning, which, according to religious figures he trusted, could take 11-14 months. Consequently, he adopted these periods for his calculations.
Interpretation
The Coppock curve issues a buy signal when it’s below zero and its slope turns positive. Given short-selling is not its purpose, it doesn’t generate sell signals. For most stock markets, who tend to trend up over time, the indicator will spend most of its time above zero.
Given its calculation via averaged-out data, the Coppock curve is not designed to pick bottoms or price reversals. Rather it is intended to generate buy signals once evidence of a rally is starting to take place.
Uses
With the Coppock curve based on averages, this tends to make it better suited toward stocks and stock indices and less so with respect to commodities and currencies.
Bottoms in equity markets also tend to be sharper than those of other asset classes. Given the way equities valuations are fueled by the expansion and contraction of credit – with expansion being a slower process than the wave of defaults that tend to compound at the end of the cycle – stocks tend to gain in value relatively slowly compared to the way in which they shed value in a correction or bear market.
Commodities are more heavily determined based on supply and demand, though the nature of investment cycles can make some amenable to this indicator, such as crude oil.
Currencies are more chiefly valued based on interest rates and fiscal and current account balances. While valuation spikes can and do occur in these asset classes, they’re not as common.
Below is the Coppock curve applied to the S&P 500:
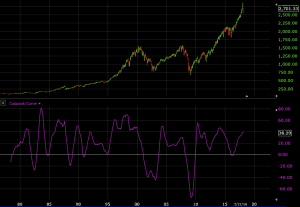
As we can see, the curve has generated eight buy signals since 1980. Three of them were small and were based on upturns in the curve when they were barely below zero (one in 1984, one in late 1990, and one in early 2016). Two were generated in the 2000-2005 period and one was generated in 2009 in the upturn after the financial crisis.
If this is applied to a currency, such as the GBP/USD, the signals aren’t as clear:
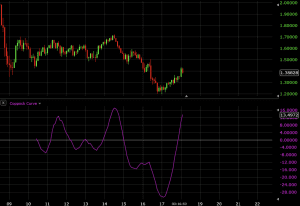
Currencies tend to have smoother price action, which, as mentioned, makes them less ideal.
Crude oil is highly dependent on global growth conditions and subject to credit cycles similar to stocks, given the capital-intensive nature of the exploration and production industry. Hence, the Coppock curve signals are more reliable:
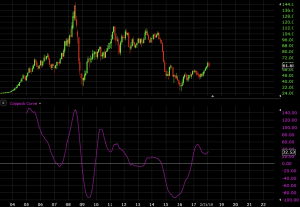
In the case of oil, we see two minor buy signals in 2007 and 2013. There were major buy signals in 2009 (recovery in global growth from financial crisis) and the latter part of 2015 (just before the bottom in oil in response to the end of the previous oil investment cycle).
Alternative Uses
In the above examples, the Coppock curve has been limited to its original intention as something that could help determine the trend on the monthly chart.
For most traders, the monthly chart can be a reference to see the decades-long price history of an asset. But trading off this time compression can be extraordinarily slow.
For this reason, the indicator can also be used on the weekly, daily, and/or smaller charts. To retain the same shape of the curve, the rate of change inputs can be time-adjusted from 11- and 14- to something higher if going down to a shorter charting time period, and the weighted moving average input can be altered from the default 10-period setting as well.
For example, if the Coppock curve was plotted on the weekly chart, the same setting could be maintained by multiplying everything by 4.33 (there are approximately 4.33 weeks per month). So the 11- and 14-month rates of change become 48-week and 61-week rates of change, respectively, and the weighted moving average becomes a 43-week MA.
In this case, you get the same visual, but a bit more resolution in the price chart relative to the monthly chart.
One is free to use his or her own discretion when choosing the setting for the curve. The default settings are by no means a scientific approach to deriving when stocks (the recommended asset for using this type of indicator) are likely to increase in value.
One also has the latitude to include sell signals. Following the converse of the buy signal criteria, the curve would need to be above 0, generated from the curve cresting and coming down after a top.
For example, here is a prospective sell signal involving the S&P 500 on a 15-minute chart, using settings of 64-period and 128-period for the rates of change (equivalent to 16 and 32 hours, respectively) and a 64-period weighted moving average.
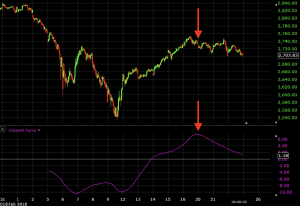
This signal would stay valid until the Coppock curve value hits zero.
Taking sell signals, and shorting stocks more broadly, is risky given that stock markets tend to go up over time. Most stocks in the S&P 500 underlie cash-producing companies. Given that the fundamental value of a business is the amount of cash you can extract from it over its life discounted back to the present, stocks are expected to incrementally increase in value over time. Therefore, shorting tends to be much more difficult, especially on trades that last multiple weeks or months.
Sell signals in the context of ongoing bull markets in steady (or strong) economies are generally temporary dips.
Recommended Settings for the Coppock Curve
The settings of the Coppock curve should be dependent on your intended trade duration as it relates to the time settings of the chart.
The default 11- and 14-period rate of change and 10-period weighted moving average setting is fine for a monthly chart for long-term “buy-and-hold” investors.
This takes around a year’s worth of previous data to form the indicator. If you extend out the settings, you will encapsulate more data. This will have the benefit of smoothing out the indicator and provide less choppy behavior in the curve and generate fewer signals.
But it may also integrate more older data that is no longer relevant to catching the prevailing trend. The purpose of technical analysis is to use price and/or volume history to make better informed predictions about future price behavior. If something isn’t effective in doing this, then it may not be helpful.
If we use the hourly chart on the S&P 500 and use 64- and 128-period settings for the rates of change and a 64-period for the weighted moving average, these are relatively long settings that will produce a smooth curve and few signals. 64- and 128-period settings will capture roughly 10 and 20 days’ worth of data, respectively, provided that US stock markets are open 6-1/2 hours per day. This is generally plenty of data to measure trends for someone trading off a relatively short time compression.
Over the past three months, the Coppock curve has generated two signals off the hourly chart on the S&P 500 (or just one, if you’re biased toward long-only trades on equities and in line with the indicator’s original purpose). The first is a sell signal and the second a buy signal, denoted by the vertical grey lines.
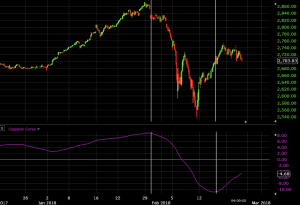
The first was profitable. (The signal to exit the trade was generated when the curve crossed zero.) The second is still open at the time of writing and is currently profitable.
If we cut these settings by a factor of 8, to 8- and 16-period for the rates of change and an 8-period for the weighted moving average, we see a much choppier chart and more frequent signals. (The space between the grey lines denotes an area where a trade would hypothetically be open.)
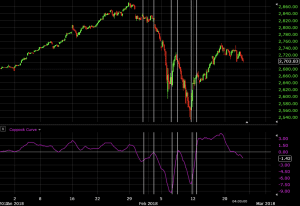
If one considers the prospective sell signals on the very left of the chart, we can see that very few of them would have worked out, if one is open to taking them. The first buy signal would have roughly broken even. The second and third were more effective.
Given the rapid changes that occur on low-period settings, trades are more likely to be short-term. For those who like more active trading styles, even opening and closing positions minutes or hours apart, low-period settings could be more amenable to this trading style.
If one wants to increase the reliability of signals based on these particular settings, one could impose a rule that states that signals don’t become valid until the Coppock curve forms a trough below -5.00 rather than the curve simply making a bottom somewhere below zero. (This figure would vary heavily depending on the time chart.) This would produce fewer, but perhaps more reliable, prospective trade signals.
The Coppock curve can also be used in addition to other indicators to increase the validity of the analysis. The greater the number of indicators that align, generally the greater the probability of the trade working out.