MACD – Moving Average Convergence Divergence


The moving average convergence divergence indicator – better known as MACD (pronounced “mac-dee”) – is one of the most popular tools in all of technical analysis and has been in use since the late 1970s. The MACD is part of the oscillator family of technical indicators.
Top Brokers For MACD Analysis Trading
-
1
 Interactive Brokers
 -
2
 NinjaTrader
 -
3
 eToro USAeToro USA LLC and eToro USA Securities Inc.; Investing involves risk, including loss of principal; Not a recommendation
 -
4
 Plus500USTrading in futures and options involves the risk of loss and is not suitable for everyone.
It is designed to measure the characteristics of a trend. This includes its direction, magnitude, and rate of change. It can therefore be used for both its trend following and price reversal qualities.
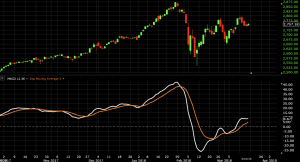
The MACD is comprised of two different lines and visually appears as follows (bottom chart):
It is calculated from three different series:
- The MACD series: this is the difference between a “long” exponential moving average (EMA) and a “short” EMA.
- The “average” or “signal” series is the EMA of the MACD series described above.
- The “divergence” series is the difference between the MACD series and average series.
Meaning of “Moving Average Convergence Divergence”
The MACD derives its name from the moving averages it’s based on plus how they act.
Convergence relates to the two moving averages coming together. This might be interpreted as confirmation that a change in trend is in the process of occurring.
Divergence can have two meanings. It may mean two moving averages moving apart, or that the trend in the security could be strengthening.
Divergence could also refer to a discrepancy between price and the MACD line, which some traders might attribute significance to.
If price is making a high while the MACD line is declining (called “negative divergence” or “bearish divergence”), this could indicate that price could fall. If price is making a new low while the MACD line is increasing (called “positive divergence” or “bullish divergence”), this could indicate that price could rise.
Settings of the MACD
MACD is generally set up with the notational form MACD(a,b,c). The letter variables denote time periods.
The variables a and b refer to the time periods used to calculate the MACD series mentioned in part 1 above. These are subtracted from each other (i.e., short EMA minus long EMA).
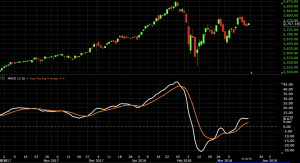
This represents one of the two lines of the MACD indicator and is shown by the white line below. (Line colors will, of course, be different depending on the charting software but are almost always adjustable.)

The variable c represents the time period of the EMA taken of the MACD series above. That represents the orange line below added to the white, MACD line.
The MACD’s a, b, and c parameters are generally set to MACD(12,26,9). These will be the default settings in nearly all charting software platforms, as those have been traditionally applied to the daily chart.
In a previous era, the trading week was six days instead of five.
Therefore, the logic behind these settings were that the 12-period (“fast”) EMA would track the trend over the past two weeks. The 26-period (“slow”) EMA would track the trend of the past month. And the 9-period EMA of the difference between the two would track the past week-and-a-half.
Traders always free to adjust them at their personal discretion. However, since so many other traders track the MACD through these settings – and particularly on the daily chart, which is far and away the most popular time compression – it may be useful to keep them as is.
Part of the reason why technical analysis can be a profitable way to trade is because other traders are following the same cues provided by these indicators. Price frequently moves based on these accordingly.
Varying from the MACD(12,26,9) Setup
The standard MACD(12,26,9) setup is useful in that this is what everyone else predominantly uses. But varying these settings to find how the trend is moving in other contexts or over other time periods can certainly be of value as well.
For example, traders can consider using the setting MACD(5,42,5). When used on the daily chart, this sets the fast EMA to a week’s worth of data, the slow EMA to two months’ worth of data, and the EMA of the MACD series (signal line) to five periods.
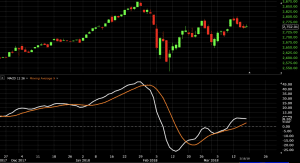
The wider difference between the fast and slow EMAs will make this setup more responsive to changes in price. Also, the shorter EMA of the MACD series will tend to create faster and more frequent signal line crossovers. The MACD(5,42,5) setting is displayed below:
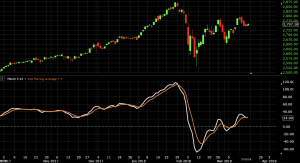
The shorter the EMA of the MACD series, the closer it will approximate the MACD series. If the EMA of the MACD series is set to one period, it will be precisely equal to the MACD series, as shown below:
This is an option for those who want to use the MACD series only. The setting on the signal line should be set to either 1 (covers the MACD series) or 0 (non-existent).
Basic Mechanics and Interpretation of the MACD
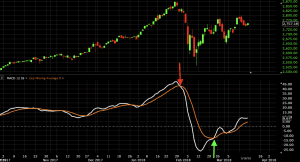
When price is in an uptrend, the white line will be positively sloped. The 12-period EMA will respond faster to a move up in price than the 26-period EMA, leading to a positive difference between the two.
The orange line (signal line) – the 9-period EMA of the white line (MACD line) – will track the trend of the white line. The way EMAs are weighted will favor the most recent data. When the EMA-9 crosses above the MACD(12,26), this is considered a bearish signal. It means the trend in the stock – its magnitude and/or momentum – is starting to shift course. When the MACD(12,26) crosses above the EMA-9, this is considered a bullish signal.
We can see instances of each below marked by arrows:
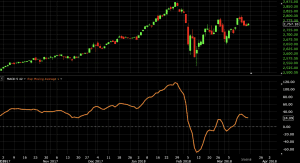
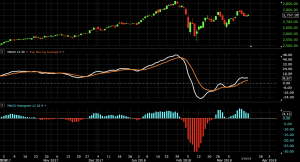
It is also common to see the MACD displayed as a histogram (a bar chart, instead of a line) for ease of visualization. Charting software will usually give you the option of being able to change the color of positive and negative values for additional ease of use.
With the crossover of the MACD(12,26) and EMA-9 being the key trading signal, many prefer the histogram.
It should be noted, however, that if you use the histogram only, then you won’t be able to see whether the MACD line is positive or negative, or whether the trend is interpreted as being up or down. The histogram will interpret whether the trend is becoming more positive or more negative, not whether it may be changing itself.
The histogram, along with a standard MACD oscillator and price chart, is displayed below:
How is the MACD Useful?
The MACD is based on moving averages. Since moving averages accumulate past price data in accordance with the settings specifications, it is a lagging indicator by nature. It is simply designed to track trend or momentum changes in a stock that might not easily be captured by looking at price alone.
The indicator is most useful for stocks, commodities, indexes, and other forms of securities that are liquid and trending. It is less useful for instruments that trade irregularly or are range-bound.
Fuller Interpretation
The MACD revolves around using exponential moving averages of varying lengths (sometimes referred to as “speeds” – fast (short) versus slow (long)). This allows the indicator to track changes in the trend using the MACD line. The signal line tracks changes in the MACD line itself.
For those who may have studied calculus in the past, the MACD line is similar to the first derivative of price with respect to time. The signal line is similar to the second derivative of price with respect to time, or the first derivative of the MACD line with respect to time.
Crossovers
Signal Line Crossover
The crossover – often termed the “signal line crossover” – occurs when the MACD line crosses the signal line. Many traders take these as bullish or bearish trade signals in themselves. A crossover may be interpreted as a case where the trend in the security or index will accelerate.
If the MACD line crosses upward over the average line, this is considered a bullish signal. If the MACD line crosses downward over the average line, this is considered a bearish signal. This is easily tracked by the MACD histogram. A bullish signal occurs when the histogram goes from negative to positive. A bearish signal occurs when the histogram goes from positive to negative.
Zero Line Crossover
A crossover of the zero line occurs when the MACD series moves over the zero line or horizontal axis. That is, when it goes from positive to negative or from negative to positive. This means that the two EMAs comprising the MACD series are precisely equal.
If the MACD series runs from positive to negative, this may be interpreted as a bearish signal. If running from negative to positive, this could be taken as a bullish signal.
While zero crossovers may indicate a change in the direction of a trend, traders generally place more on a signal line crossover, as a zero crossover provides no indication in itself in the trend’s rate of change.
Moving Car Analogy
You can think of think of the MACD in terms of the basic physics of a moving car.
When a car is moving forward (positive velocity) and is accelerating (velocity increasing), that means it’s getting from point A to point B faster. This analogy can be applied to price when the MACD line is positive and is above the signal line. This is a bullish sign.
If the car slams on the breaks, its velocity is decreasing. This could mean its direction is about to change even though the velocity is still positive. This would be the equivalent to a signal line crossover but with the MACD line still being positive. Some traders might turn bearish on the trend at this juncture.
If a car is going in reverse (negative velocity) and is accelerating in the reverse direction (velocity decreasing, or becoming more negative), this means it’s moving away from its previous location more quickly. This is the equivalent to the MACD’s interpretation of price when the MACD line is negative (negative velocity) and the signal line is above the MACD line (negative acceleration). This is a bearish sign.
Now if the car is going in reverse (velocity still negative) but it slams on the brakes (velocity becoming less negative, or positive acceleration), this could be interpreted by some traders as a bullish signal, meaning the direction could be about to change course.
Some traders only pay attention to acceleration – i.e., the signal line crossover (or what’s expressed by the MACD histogram). They feel that the change in the trend is most important and use it as more of a price reversal indicator rather than its trend following component (whether the MACD line is positive or negative – “velocity”).
Some traders, on the other hand, will take a trade only when both velocity and acceleration are in sync. Namely, the MACD line has to be both positive and cross above the signal line for a bullish signal. Or the MACD line has to be both negative and crossed below the signal line for a bearish signal.
As aforementioned, the MACD line is very similar to the first derivative of price with respect to time. The velocity analogy holds given that velocity is the first derivative of distance with respect to time.
The signal line is very similar to the second derivative of price with respect to time or the first derivative of the MACD line with respect to time. Moreover, the acceleration analogy works in this context as acceleration is the second derivative of distance with respect to time or the first derivative of velocity with respect to time.
The Importance of Filtering
The MACD is not a magical solution to determining where financial markets will go in the future. Taking MACD signals on their own is a risky strategy. Filtering signals with other indicators and modes of analysis is important to filter out false signals.
With respect to the MACD, when a bullish crossover (i.e., MACD line crosses above the signal line) occurs, yet the security’s price declines, this is referred to as a “false positive”. When a bearish crossover occurs (i.e., MACD line crosses below the signal line), yet the security’s price increases, this is deemed a “false negative”.
Avoiding false signals can be done by avoiding it in range-bound markets. Below, in the left half of the chart, we see multiple signals from shallow crossovers that don’t give well-defined signals.
As is the case with all technical indicators, taking signals from just one isn’t likely to tilt the odds in your favor over a sufficient enough period of time.
Having confluence from multiple factors going in your favor – e.g., alignment of 2-3 indicators, candlestick patterns, support/resistance, fundamental analysis – will improve the probability that any given trade works out.
Trade Examples
Example #1
If trades are taken on the basis of crossovers of the MACD series and signal line, this implies that you’re always in the market. Unless you filter it more stringently, you’re either always in a buy/long trade or sell/short trade and will oscillate between the two.
Consider the following daily chart of the EUR/USD where the buy/long signal is a crossover of the MACD series above the signal line and sell/short signal is a crossover of the MACD series below the signal line. Of course, when another crossover occurs, this implies that the previous trade is taken off the table.
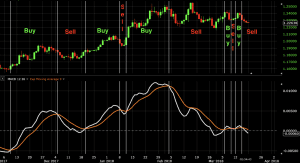
Of those ten trades, roughly three were winners, two were losers, and the other five were almost too close to call.
Here we covered about five months’ worth of price data. Though collectively there would have been a little bit of profit made following the standard signal line crossover strategy from the MACD(12,26,9) settings, this strategy is too naïve to make an entire system around.
Example #2
Instead, let’s consider adding to it to make it at least slightly more robust. In this case, we’ll add a 50-period simple moving average (SMA). Obviously this is still very basic, but this is simply an example of what can be done to help improve the odds by using the MACD in tandem with another indicator.
We’ll make this a three-rule system governing entries and exits.
- Enter trades upon a signal line crossover. MACD series above the signal line is a bullish signal. MACD series below the signal line is a bearish signal.
- Enter trades only in the direction of the trade, as dictated by a 50-period SMA.
- Exit when there is another signal line crossover, or the slope of the 50-period SMA changes.
The number of trades are reduced from ten to three:
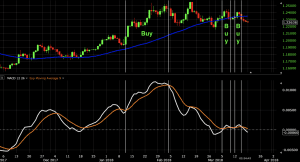
After refining this system, we see the same nice winner we got in the first case and two trades that roughly broke even.
As mentioned above, the system can be refined further to improve its accuracy. This may involve the inclusion of other indicators, candlestick and chart pattern analysis, support and resistance levels, and fundamental analysis of the market being traded.
If other indicators are included, it’s best not to go overboard. If you’re waiting for six indicators to align perfectly, you’ll probably end up with a very messy and confusing chart. You never want to end up with information overload. Being conservative in the trades you take and being patient to let them come to you is necessary to do well trading. But if you’re too conservative then you’ll never end up taking trades altogether. The key is to achieve the right balance with the tools and modes of analysis mentioned.
Conclusion
The MACD is one of the most popular indicators used among technical analysts. It helps identify the trend’s direction, its velocity, and its rate of change. A MACD crossover of the signal line can help spot when the trend’s acceleration is changing. A MACD crossover of the zero line may be interpreted as the trend changing direction entirely.
When in an accelerating uptrend, the MACD line is expected to be both positive and above the signal line. In an accelerating downtrend, the MACD line is expected to be both negative and below the signal line.
Some traders will focus exclusively on the acceleration component of MACD (signal line crossover of the MACD line). However, some traders will choose to have both in alignment.
The MACD is a versatile indicator and can be used as part of a trader’s tool kit for purposes of confirming trends and potential price reversals.