ADX and ADXR


The average direction index (ADX) is used to determine the strength of a trend and often used in trend-following strategies.
Top Recommended Brokers For Trading With ADX & ADXR

ADX uses an absolute value approach; namely, it will quantify the strength of a trend irrespective of its direction. A value of 40 could denote the strength of a trend whether an uptrend or downtrend. The ADX is plotted below the price chart using the difference between two measures known as the +DMI and -DMI (directional movement indicators).
If the +DMI is above the -DMI, this means that price is in an uptrend. If the -DMI is above the +DMI, price is in a downtrend.
The ADX is generally set to a (14,14) setting, meaning the 14 previous price bars are included in the indicator, with a smoothing set to how heavily to weight near-term data. The lower each number is in each setting, the more prominent the trends will be (i.e., higher ADX reading) since a smaller subset of priced data is used. If set unusually low, everything will appear to be a strong trend. If set too high, everything will appear to be a non-trend as mismatches between supply and demand tend to not last for elongated periods.
ADXR (Average Directional Movement Index Rating)
A second line that accompanies the ADX, the ADXR, measures the difference in the change of momentum in the ADX. The period can be set to a certain number of bars to measure this change.
Here are the ADX and ADXR plotted on a monthly EUR/USD chart:
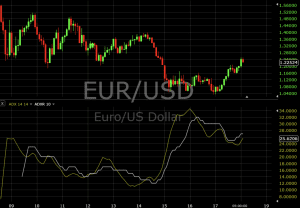
A period of 0 effectively means that the ADXR is the ADX. A period of 100 will cause the ADXR to measure the change in momentum over a very long period (the ADX of the past 100 price bars) that might make it non-meaningful. A typical period is around 10.
Overall, ADXR is a lagging indicator that acts as an averaged ADX. In terms of trending signals, the ADXR will always generate them after the ADX. Some interpret the system to mean that a buy signal is generated when ADX rises above ADXR. And a sell signal might be interpreted when ADX falls below ADXR if at a point where both (or just the ADX) are at 25 or higher.
Interpretation
The ADXR’s interpretation is essentially equal to that of the ADX. A higher value corresponds to a stronger trend. Using the ADX in conjunction with the ADXR by making them both align will produce more conservative, but potentially more accurate, trading signals. A reading of 25 or greater on each indicator is commonly taken as a subjective indication that price has sufficient momentum to indicate a trend worth trading. A reading below 25 may be taken as an indication that trend-following strategies should be avoided.
Trend strength is determined by the direction of the ADX line. When the ADX is increasing, trend strength is rising. A deceleration into range-bound behavior is indicated by a falling ADX. A falling ADX does not mean that the trend is reversing, only weakening. Even if ADX is decreasing, but still at 25 or greater, this is an indication that the trend remains strong.
Letting trades run when ADX is higher than 25 (or through a combination of a 25 or higher reading, plus ADX/ADXR crosses in the more conservative system) is promoted by momentum/trend traders to “let winners run”.
A weakening trend – but still above 25 – is not an indication to exit but rather an indication that one should be mindful that momentum may be waning.
ADX can also help inform a trader of price and momentum/trend divergence. If price is making a higher high but the ADX is declining (but still strong), this could warn a trader that momentum may be slowing.
This could tell a trader to take some level of profit off the table by decreasing position size or pushing up the stop-loss closer to where price currently is. Any time the reason for getting into a trade changes, it’s time to reassess the position or manage risk.
Example of Trading ADX and ADXR
Let’s use a monthly chart of the S&P 500, plotting ADX and ADXR with their usual settings (ADX period and smoothing both set to 14; ADXR period set to 10).
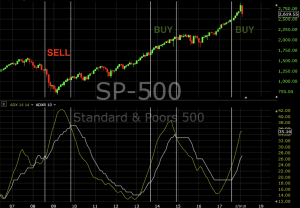
This chart roughly covers the past ten years of price data. In total, it has generated three trade signals:
- A short-sell generated during the financial crisis generated at the end of September 2008, lasting through October 2009 (about a 10% profit)
- Generated from a cross of the ADX above the ADXR and closed after the ADXR rose back above the ADX.
- A long generated in September 2013, lasting to December 2014, which would have netted a profit of 25%-30%.
- ADX rose above 25, was already above the ADXR. Closed when ADXR crossed back above ADX.
- A long generated in August 2017, which is still active but has returned a profit of about 7%.
- ADX rose above 25 and was already above the ADXR. No sell signal has yet been generated.
ADX For Trending and Range Identification
In technical analysis, price is the most important component on a chart. Technical indicators should be used to supplement this reading or inform traders of something that might not be otherwise read from price alone.
In range-bound markets, a common teaching in technical analysis is that the tighter a trading range becomes the greater the likelihood of an imminent breakout. ADX can work to inform traders when breakouts have the momentum behind them to sustain themselves, often indicated by a breach above 25.
When ADX drops below this level, even if price appears to be in a clear trend, it can communicate that weakening trend or range-bound behavior is likely to occur. This is indicated by ADX levels of 0-25. In these markets, buyers and sellers are roughly in agreement on price and these markets are characterized by narrow bid-ask spreads.
It then takes some type of catalyst to change the supply and demand dynamics, which may produce a market that trends in one direction or another.
Conclusion
ADX – also in combination with ADXR – can provide trading signals based on a momentum or trend-following strategy. Philosophically, the ADX is based on the idea that the best profits are made in trending, rather than ranging, markets.
ADX determines whether price is trending or non-trending. ADXR then supplements ADX by determining whether ADX is gaining or declining.
When ADX is above 25 and is above ADXR (i.e., uptrend gaining steam), traders might interpret this as a buy signal. When ADX is above 25 and ADXR rises above ADX, this might be interpreted as a signal to get out of a long trade or begin a sell trade. An ADX level between 0 and 25 might be taken as an indication to avoid trend-following strategies altogether.
Some traders may use ADX only and takes trades in the direction of the prevailing trend on a pullback to a support or resistance level. Different traders will work through trial and error to develop a system that works best for them in producing winners and profits while minimizing emotions.