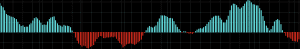
Elliott Wave Oscillator


The Elliott Wave Oscillator (EWO) is the difference between a 5-period and 35-period simple moving average (SMA) based on the close of each candlestick.
The Best Brokers For Elliott Wave Oscillator Analysis
-
1
 Interactive Brokers
 -
2
 NinjaTrader
 -
3
 eToro USAeToro USA LLC and eToro USA Securities Inc.; Investing involves risk, including loss of principal; Not a recommendation
 -
4
 Plus500USTrading in futures and options involves the risk of loss and is not suitable for everyone.
Formulaically, the oscillator can be expressed as:
EWO = SMA(5-period, candle-close) – SMA(35-period, candle-close)
Uses of the Elliott Wave Oscillator
Interpretation of the EWO can be done through what its individual components tell you.
A 5-period moving average is much more responsive to price than a 35-period moving average. Fewer price data points are included the 5-period. The 35-period moving average is slower to react to price as the previous closing price comprises just 2.9% of its value (1/35). The 5-period moving average, on the other hand, is based on 20% of the previous candle’s closing price.
Therefore, if price is in an uptrend, and this uptrend has been stronger over the previous five candles relative to the previous 35, then the EWO will be positive. If price is in an uptrend, but price has been in a stronger overall uptrend over the past 35 candles relative to the previous five, the EWO will be negative.
Likewise, we can apply this to downtrends. Stronger downtrends over the past five candles relative to the past 35 will produce a negative value for the EWO. A downtrend over the recent five candles that has not been as strong as the one over the past 35 candles will also produce a negative value for the EWO.
Hence, we can interpret positive or negative EWO values in different ways:
Positive EWO value
- a) Strengthening trend OR
- b) Weakening downtrend
Negative EWO value
- a) Strengthening downtrend OR
- b) Weakening uptrend
Trading Examples of the Elliott Wave Oscillator
The Elliott Wave Oscillator is fundamentally a trend-following indicator.
We can view it in one of two ways. We can either look at its value – positive or negative – or we can look at its rate of change.
If the EWO is both positive and increasing, this is a bullish sign on two fronts. The near-term trend is bullish and the uptrend is getting stronger.
If the EWO is both negative and increasing, this is doubly bearish. The near-term trend is bearish and the downtrend is becoming stronger.
If we require those two conditions to be met when taking a trade at the very least, it is likely to increase its accuracy. A straightforward interpretation might be to go long when the indicator is positive and go short when the indicator is negative. However, trading based on signals that inherently lag price is not the best idea.
Multiple factors should line up to help confirm trade signals. This could include the use of price, support and resistance levels, different technical indicators, and fundamental analysis of the market being traded. Essentially whatever it takes to get the trading decision correct.
The EWO on its own will produce a ton of signals due to the natural frequency of 5-SMA and 35-SMA crossovers. But on its own that’s not a valid trading system, so strict filtering is necessary. Pairing it with a moving average of longer duration (e.g., 50- or 100-period SMA) and taking trades in the direction of the trend as dictated by that indicator will improve its reliability.
Additionally, instead of a mere positive value for the EWO, we can also better improve its reliability by ensuring that for long trades, its value is sufficiently positive by a specific magnitude. For short trades, we can institute a rule where the EWO is negative by a certain amount. This helps in consolidating markets where frequent moves above and below the indicator’s zero line can give multiple weak signals.
Elliott Wave Oscillator Trade Criteria
So we will look at how the Elliott Wave oscillator may have fared on various chart examples using the criteria below:
1) Long trade: Positive EWO value (of +X amount) + Increasing EWO value + Positively sloped 50-period simple moving average
2) Short trade: Negative EWO value (of –X amount) + Decreasing EWO value + Negatively sloped 50-period simple moving average
Exit strategy:
1) Exit long: EWO magnitude begins decreasing or simple moving average turns negative
2) Exit short: EWO magnitude beings increasing or simple moving average turns positive
In other words, to trade long, we want the EWO to be in the process of being not only positive, but increasingly positive. The trend, as interpreted through the simple moving average, should also be positive.
To trade short, we want the EWO to be not only negative, but increasingly negative. We also want the simple moving average to be negative.
An exit would entail when any one of these given signs is broken.
Example #1
Let’s look at a daily chart of the S&P 500.
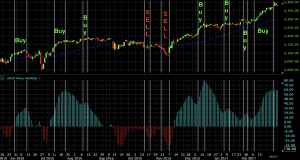
Over this roughly nine month timeframe, we have nine trades – 7 longs and 2 shorts, as marked between the vertical white lines. These were generated when all three of our criteria are met.
For longs, this means a positive EWO value of a certain magnitude, an increasing EWO value, and a positively sloped SMA.
For shorts, this means a negative EWO value of a certain magnitude, a decreasing EWO value, and a negatively sloped SMA.
Collectively, the seven longs generated a bit of profit, taking advantage of the ongoing uptrend. The two shorts roughly broke even.
Example #2
Below we have a daily chart of the EUR/USD.
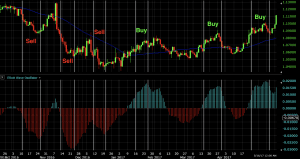
In this case we have six trades – 3 shorts and 3 longs, once again marked between the vertical white lines.
Our short criteria held throughout each short trade – negative EWO, EWO of -0.05 or lower (this value will vary by the asset and timeframe), decreasing EWO, and negatively sloping 50-period simple moving average.
Our long criteria – positive EWO, EWO of +0.05 or higher, increasing EWO, and positively sloping 50-period simple moving average – also held throughout.
Each of the first four were winners to some extent. The last two roughly broke even.
Conclusion
The Elliott Wave Oscillator uses the basic concept of a moving average crossover to generate trade signals. It is fundamentally a trend-following, momentum indicator.
Trades are designed to be taken in the direction of the indicator. Namely, this means long trades for positive EWO readings and short trades for negative EWO readings. It must nonetheless be paired with other indicators and ideally other forms of analysis as these indicators are not designed to be used on their own.
Indicators that integrate previous data inherently lag price. While they may describe the recent past, they may not necessarily shed any insight into what will happen in the future.
It is more common for the EWO, and other moving average crossover indicators, to be used to confirm trade ideas generated from the price chart. It is not advisable to use them as signals themselves. If trade ideas are signaled by the EWO, they should be rigorously filtered with other tools.
We can also use the EWO on multiple charting timeframes, from the 1-minute time compression all the way up to the monthly (or higher if such a setting exists on your charting software).