Directional Movement (+DI –DI)


The Directional Movements Indicators, Positive DI (+DI) and Negative DI (-DI), make up the Directional Movement system, and are also calculated as part of the Average Directional Movement Index (ADX).
The Positive DI and Negative DI are plotted individually, with the +DI often highlighted in green and –DI highlighted in red.
Top Brokers For Directional Movement Analysis Trading

Calculation of Directional Movement
1. Directional Movement calculates two components, +DM and –DM. These are both inputs into the eventual +DI and –DI calculations.
+DM is equal to the high of the current price bar minus the high of the previous price bar.
-DM is equal to the low of the current price bar minus the low of the previous price bar.
The smaller value of the two is reset to zero. For example, if +DM is greater than –DM, then –DM is zero, and vice versa. It is also possible that both are equal to zero in the case of an inside bar, in certain cases where price gaps exist (i.e., market closes periodically, such as daily with stock markets or over the weekend in foreign exchange markets). A reading of zero would denote no directional movement for the given period.
2. Next, the true range for each period is calculated.
True Range (TR) = Max[(High – Low), (High – Previous Close), (Previous Close – Low)]
The +DM, -DM, and TR are calculated for each period (via price data within each price bar). They are then smoothed using a method proposed by the indicator’s developer Welles Wilder through the process of summation (i.e., arithmetic series).
For smoothing over X periods, 1/X of each period’s value is added onto each calculation as a form of exponential smoothing. This inversely weighted add-on factor works to increase the influence of new data points versus old. The formulas are as follows:
+DMt = [+DMt-1 – (+DMt-1 / n)]
-DMt = [-DMt-1 – (-DMt-1 / n)]
TRt = [TRt-1 – (TRt-1 / n)]
Where:
+DMt = +DM at a given time, t
+DMt-1 = +DM at a given time, t-1 (or one period in before time t)
-DMt = -DM at a given time, t
-DMt-1 = -DM at a given time, t-1
TRt = TR at a given time, t
TRt-1 = TR at a given time, t-1
3. Finally, the Directional Indexes, both positive and negative form, +DI and –DI, can be calculated. They involve taking Directional Movement, dividing it by the True Range, and multiplying by 100.
+DI = (+DM / TR) * 100
-DI = (-DM / TR) * 100
Directional Movement Examples
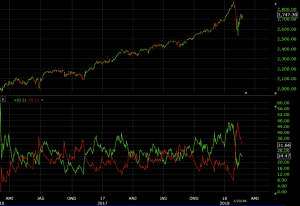
S&P 500 Daily Chart
Fifteen periods is the standard setting for the +DI/-DI indicator. This, of course, can be adjusted. For the daily chart setting, 21 periods is common. This periodicity tracks back a month’s worth of data with approximately 21 trading days per month.
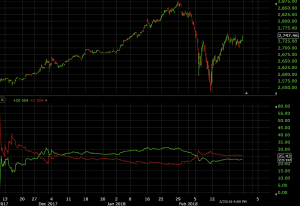
For 24/5 markets such as forex or crude oil, if one wanted to use the same amount of prior data on the hourly chart as the daily chart above, one would multiply 21 (roughly the number of days per month) by 24 (number of hours in the day) to get 504 as the new period setting. The indicator would, of course, be very slow and relatively unreactive to current price data. It would nonetheless allow a trader to look at price action with a higher level of resolution.
How is this traded?
It’s not recommended to buy and sell off the Directional Index readings alone.
However, a common interpretation is to take a long/buy trade when the +DI (green line in the diagram) crosses above the –DI (red line). This can either be done after a candle’s close or as it happens in real-time.
Some might also set certain rules, such as trade confirmations only after the difference between the +DI and –DI exceeds a certain amount. It is often common in ranging markets for the +DI and –DI to cross frequently. Accordingly, any trade signals from a +DI/-DI crossover would be invalidated quickly.
The extent of the gap between +DI and –DI will depend on the timeframe, the asset being traded, and the periodicity of the indicator. For the S&P 500 daily chart with a +DI/-DI period setting of 21, waiting for the +DI/-DI difference to be at least 3 might be sufficient evidence that a trend is forming in one direction or another.
However, there is always the chance that the longer you wait for trend confirmation, the greater the likelihood you miss out on the bulk of a move or fail to catch it entirely.
From the daily chart below, we can see that the previous consolidating market produced multiple +DI/-DI crossovers. But any trades taken off of these would have been closed out quickly. But the bullish signal from a +DI/-DI gap of 3 (demarcated by the first vertical line) would have produced a nice gain.
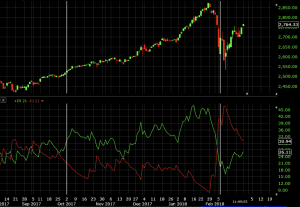
A crossover of the green +DI line below the red –DI line might generate a signal to close out the trade.
Nevertheless, when it came to a bearish signal (second white vertical line) – e.g., -DI greater than +DI by 3 or more – the market moved so quickly that by the time the indicator confirmed a short trade, the move was largely already over.
Conclusion
Directional Movement is a trend-following indicator and should not be used in isolation as a trade system. It is merely a tool that can be used to track the momentum, trend, or direction of a market.
Ideally, +DI and –DI lines should be used as part of a broader set of indicators to help confirm the trend. Whether the indicator is used to generate trade signals in itself (+DI/-DI line crossover) or merely as a supplement to other indicators and/or forms of analysis is left to the discretion of the trader.