Linear Regression Line


Linear regression, when used in the context of technical analysis, is a method by which to determine the prevailing trend of the past X number of periods.
The Best Brokers For Linear Regression Line Trading
-
1
 Interactive Brokers
 -
2
 NinjaTrader
 -
3
 eToro USAeToro USA LLC and eToro USA Securities Inc.; Investing involves risk, including loss of principal; Not a recommendation
 -
4
 Plus500USTrading in futures and options involves the risk of loss and is not suitable for everyone.
Unlike a moving average, which is curved and continually molded to conform to a particular transformation of price over the data range specified, a linear regression line is, as the name suggests, linear. It takes a certain number of user-defined periods and plots a linear line that best fits the general trend.
To clarify, it is not simply taking the current price and the price from X number of periods ago and drawing a line between the two. The activity in between the two points is every bit as critical.
For example, in the particular 50-day period in the S&P 500 below, the net gain of the market is positive. Yet the linear regression line is negatively sloped. This has to do with a strong down-move over the course of this period. Most forms of linear regression are based on the mean or average, which makes it sensitive to outliers. Since the mean price over this period was below where it currently stands, the linear regression line is negatively sloped.
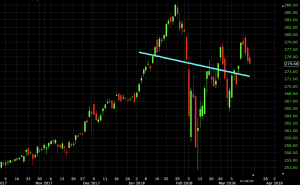
The shape of the linear regression line is simply designed to represent yet another way to track the market’s trend.
Conceptually, linear regression implies that it can predict how an output will change based on an input. In this case, it’s simply using previous price data to predict the general trend of future price data. This is, of course, a naïve assumption, but trends have a way of persisting over time until the information embedded in a market materially changes.
If we set the linear regression line to a 100-day period, we see the line markedly take a different shape:
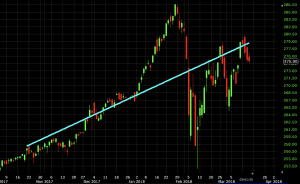
For trend traders, this might present confusing signals to have the 50-day and 100-day regression lines be so profoundly different. Which one is more “correct”?
First, it is never recommended to use any given indicator in isolation. Being in buy/long trades when a X-period regression line is pointing up and sell/short trades when a X-period regression line is pointing down will not be a profitable trading strategy.
It should ideally be made to fit your trading timeframe. Those who trade with the intention of holding positions over the course of years might apply a 200-day linear regression line to a daily chart. Someone who holds positions minutes or hours might apply a 20-period linear regression line to a 5-minute chart.
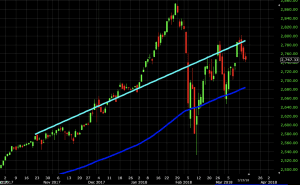
If paired with a moving average, it would make sense to have them both be the same period for equal comparison’s sake. For example, here’s the linear regression line paired with a 50-period simple moving average (SMA).
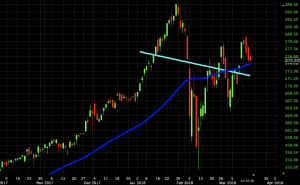
If you’re a trend follower and trust the signals that the linear regression line and SMA give you on these particular periods, you’d probably pass on anything trend-related.
Examples of the Linear Regression Line Within a Broader System
The linear regression line can be relevant when identifying the trend within a larger trading system.
Many trading systems are based on the premise that once all indicators match up, a trade signal is thereby given in a particular direction.
For example, we could invent a trading system that involves trade entries based on trading with the trend according to a 100-period linear regression line and 100-period moving average.
With respect to price reversals, we can use Keltner channels. For Keltner channels, we’ll use 20-period bands and a 3x multiple of the average true range.
Our rules are:
- Trade only with the trend, meaning both the 100-period linear regression line and 100-period moving average are in agreement.
- When the above rule is true, take long trades when price hits the bottom band of the Keltner channel. Likewise, when both the linear regression line and moving average are in agreement in a downtrending market, a touch of the upper band of the Keltner channel would be a signal to go short.
- To exit a trade, we can use either a shift in the trend – i.e., the slope of either the linear regression line or moving average changes (opposite the direction of the trade) – or a touch of the linear regression line.
Also note that backtesting this strategy is particular difficult given that the linear regression line changes shape continually. How and where it’s displayed on the chart currently is purely dependent on the market at the current moment, not where it was at some point in the past. The best you can do is infer on the basis of knowing how linear regression lines are made to fit a particular data set.
Example #1
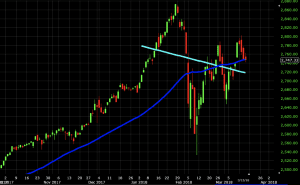
Let’s see how this would have worked out on a daily chart of WTI crude oil:
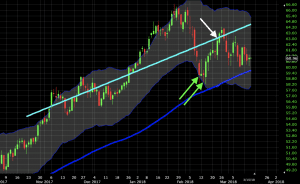 Here we have one or two trade signals (shown through the two green arrows), depending on whether you’re willing to take the same setup more than once. We see both trend confirmation tools pointing up.
We ignore price’s touch of the top band on the way up as those trades would have gone opposite the trend. But we do get a touch of the bottom band twice. This presented a solid setup to take a long trade in the direction of the up-trend of the market.
Some trader’s might take just the initial touch and ignore the subsequent touch since it’s fundamentally the same trade idea. Moreover, it might constitute “doubling down” on a position and could make one’s book (i.e., current set of live/open trades) more concentrated and dependent on a certain outcome to profit.
The trade was exited upon a touch of the linear regression line (white line).
Example #2
Let’s apply it to a daily chart of the USD/SEK (US dollar versus the Swedish krona).
With this currency pair in a downtrend, we see confluence with a down-sloping 100-period linear regression line, down-sloping SMA, and touch of the upper band on the Keltner channel.
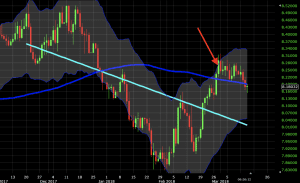
Based on the chart and our rules stipulated above, this trade would still be open if our close signal is a touch of the linear regression line. However, it would be closed if we were more flexible and extended it to a touch of the SMA or if we added a center line in the Keltner channel.
Conclusion
A linear regression line is an easy-to-read way of obtaining the general direction of price over a past specified period. Unlike a moving average, which bends to conform to its weighting input, a linear regression line works to best fit data into a straight line.
Linear regression lines will be more dependent on the period of the timeframe considered relative to moving averages. It’s rare that there will be wide dispersions in the general gradation of a moving average between, for example, 50 and 100 periods. There can, however, be a big difference between a 50-period linear regression line and a 100-period regression line.
Note the difference below.
50-period linear regression line + 50-period SMA
100-period linear regression line + 100-period SMA
A linear regression line should not be used a system itself. Rather it should be used in the context of a larger trading system – mechanical or otherwise – that uses other technical indicators, price, candlestick patterns, support and resistance levels, and/or fundamental analysis to improve the accuracy of trading decisions.