Force Index


The Force Index is part of the oscillator family of technical indicators. It uses price movement and volume to determine the strength of certain price movements and capture potential turning points in the market.
Top Brokers For Force Index Analysis Trading
-
1
 Interactive Brokers
 -
2
 NinjaTrader
 -
3
 eToro USAeToro USA LLC and eToro USA Securities Inc.; Investing involves risk, including loss of principal; Not a recommendation
 -
4
 Plus500USTrading in futures and options involves the risk of loss and is not suitable for everyone.
The Force Index (sometimes referred to as “the index”) is another technical analysis concept introduced by Alexander Elder in his book Trading For A Living. He is also the developer and namesake of the Elder Ray Index.
Calculation of the Force Index
The following formula is used to calculate a 1-period Force Index:
Force Index (x) = [Close (current period) – Close (prior period)] x Volume
The Force Index is formulated as an exponential moving average. Namely, prior data points taken from the above formula are used and the indicator is calculated as an average of these successive values. As an exponential moving average, more recent data points have more weight than older data points. The indicator is thus calculated in the general form:
Force Index (n) = n-period exponential moving average of Force Index (x)
Alexander Elder recommended a 13-period exponential moving average and this is usually the default setting on charting software. However, the periodicity setting can be altered based on user input.
Like the Elder Ray Index, the data accumulated for the indicator is taken at the daily level, making its use on smaller charting timeframes (e.g., 4-hour, 15-minute, etc.) nonviable. It will work on timeframes higher than the daily level (e.g., weekly, monthly).
Since it’s presumed that the index will be predominantly applied to the daily chart, the period setting will depend on one’s trading style. For shorter-term traders, who might hold positions over the course of a few days, the default 13-period setting might be appropriate. For longer-term traders, the period setting might be set to 50 periods, 100 periods, or even longer.
Uses of the Force Index
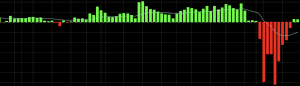
The Force Index oscillates above and below zero. When above zero, price is considered to be in an uptrend. When below zero, price is considered to be in a downtrend. If price and the index diverge, then it may be an indication that a change in the trend could be forthcoming.
A longer period on the indicator will produce a smoother trajectory and fewer oscillations. A shorter period will produce a more volatile trajectory and more frequent oscillations. While this may be more suitable for those with shorter timeframes, it will be prone to a greater number of false signals.
Accordingly, a longer period will generate fewer signals while a shorter period will generate more signals.
The index can inform a trader of certain volume-related developments that price alone will not pick up on. A potential divergence between the indicator and price may indicate potential upcoming reversals.
For example, if price is moving higher but the index is moving lower, it might mean that the uptrend is losing strength and a price reversal could be in store. Likewise, if price is moving lower but the index is moving higher, it might mean that the downtrend could be losing power and the probability of a price reversal is increasing.
It must be noted, however, that divergence should not be considered a trade signal in itself. Divergent paths between price and the index can last for elongated periods. Therefore, traders who utilize the index are best to consider other indicators in conjunction.
The indicator is often used alongside an exponential moving average (EMA) of the same period settings. For example, someone using a 21-period Force Index could filter trade signals using a 21-period EMA. Trades would be taken in the general direction of the trend, as dictated by the slope of the moving average or potentially price action or candlestick patterns.
Examples of The Force Index
A trader could put in place a rules-based system for taking Force Index trades grounded by the following:
Long trades
1) Force Index increasing or index EMA positively sloped
2) EMA of price positively sloped
3) Trade exited when EMA goes neutral or Force Index < 0
Short trades
1) Force Index decreasing or index EMA negatively sloped
2) EMA of price negatively sloped
3) Trade exited when EMA goes neutral or Force Index > 0
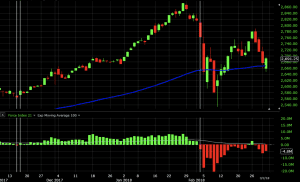
Example #1
Below is an example of how the Force Index might be applied to a daily chart of WTI crude oil, based on the above criteria. The index uses a 21-period setting.

The three buy/long trades worked in producing a profit while the two short/sell trades took minor losses.
Example #2
Below we have a 21-period Force Index applied to a daily chart of the S&P 500. Note that the EMA on the price chart is much more stable, taking into account the long-term uptrend and thereby muting much of what would be considered noise to a longer-term trader.
The first trade is a buy signal that captures all the criteria above – Force Index increasing or Force Index EMA increase and price EMA positively sloped. The trade would have been exited for a profit once the index went below zero.
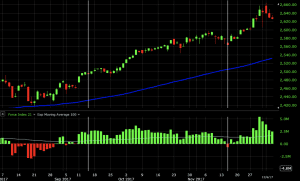
The next trade came on the very next candle as buy/long conditions were once again met.
The trade was exited once the Force Index fell below zero.
Conclusion
The Force Index is designed to gain insight into how price might move on the basis of volume. Though it is an oscillator, the indicator isn’t intended to identify “overbought” and “oversold” levels. Instead, it is largely trend-following in nature.
It is only to be used on the daily chart and higher time compressions. The inputs, such as daily high and daily low, naturally aren’t captured on sub-daily time charts. Longer-term traders, who might hold positions over weeks or months, should use longer period settings (e.g., 50 periods or above). Shorter-term traders, who might hold positions over just days, might be better suited to using shorter period settings (e.g., below 20 periods).
The index shouldn’t be used on its own, as oscillators and other indicators that use previous data are lagging by nature. The use of other indicators and methods, such as moving averages and looking at price itself, can help to better filter signals provided by the Force Index in isolation.