Elder Ray Index


The Elder Ray Index is designed to measure the amount of buying and selling power in a market. It has both a bullish and bearish component, which are plotted as two separate indicators. One is termed “bull power” while the other is called “bear power”.
Top Elder Ray Index Analysis Brokers
-
1
 Interactive Brokers
 -
2
 NinjaTrader
 -
3
 eToro USAeToro USA LLC and eToro USA Securities Inc.; Investing involves risk, including loss of principal; Not a recommendation
 -
4
 Plus500USTrading in futures and options involves the risk of loss and is not suitable for everyone.
The bull power indicator functions by showing the relation between the daily high and an n-period exponential moving average. The bear power indicator functions by showing the relation between the daily low and an n-period exponential moving average.
Bull Power = Daily High – EMA (of n-periods)
Bear Power = Daily Low – EMA (of n-periods)
Uses of the Elder Ray Index
Traders will generally use the bull power and bear power indicators in tandem. Trade signals can be generated by looking for cases when the two both communicate bullish or bearish signs.
For example, a long position might be taken under the following circumstances:
1) Bear power’s value is negative but increasing (i.e., becoming less bearish)
2) Bull power’s value is increasing (i.e., becoming more bullish)
Thus, it is inherently trend-following.
A short position might be taken in the event of the following:
1) Bull power’s value is positive but decreasing (i.e., becoming less bullish)
2) Bear power’s value is decreasing (i.e., becoming more bearish)
Traders can also plot an exponential moving average (EMA) of equal periodicity to the bull and bear power indicators to confirm the trend. A positively sloped EMA would signal a bias in favor of bullish trades. A negative sloped EMA would signal a bias in favor of bearish trades.
Examples of the Elder Ray Index
Example #1: Bullish Trades
Below is an example of the S&P 500 daily chart where the Elder Ray Index indicators are both plotted. The bull and bear components are both set to a 21-period, as is the EMA. (21 periods cover an entire month’s worth of previous data, with approximately 21 trading days per month.)
Two bullish trades are taken based on the criteria above. The bear power’s value (bottom window) is negative but increasing while the bull power’s value (middle window) is increasing.
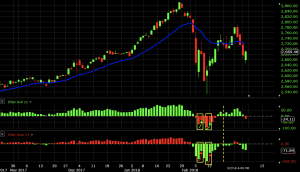
The trade signals are each encapsulated by boxes and marked by arrows.
The first trade was invalidated by the next candle and was a loser. The second trade lasted another five days before the indicators began declining again (marked by the dashed yellow line) and was a strong winner.
Example #2: Bearish Trades
Here we have an example of bearish trades taken on WTI crude oil.
These fit the criteria of bull power’s value being positive but decreasing with bear power’s value decreasing as well. The trade range for each is marked by the two yellow boxes. The first candle in the box denotes where the trade would have been first opened and the last candle where the trade was closed.
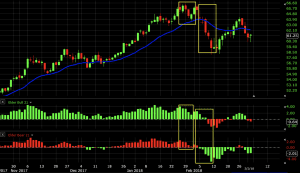
If one were to add the rule that trades must be taken with the trend according to the EMA, the first trade wouldn’t have been taken. The first trade roughly would have broken even. The second trade would have been a solid winner.
Conclusion
The Elder Ray Index measures buying and selling pressure in a market. Using its two components – bull power and bear power – one can use a rules-based system to generate trade signals. When using the indicators, it is advisable to ensure that their periodicities are set equal to each other in order to make apples-to-apples comparisons between the bull and bear components. Likewise, if using an exponential moving average to take trades in the direction of the general trend, the EMA’s periodicity should match those of the indicators.
It should be noted that the Elder Ray Index can only be used on the daily timeframe or higher, as it is fundamentally based on daily highs and lows.