Klinger Volume Oscillator


The Klinger volume oscillator is designed to predict price reversals in a market by comparing volume to price. Volume is a measure of how many units of a certain security or index are trading per unit of time.
The Best Brokers For Klinger Volume Oscillator Trading

For trading software that takes volume data at the daily level only, this will be effective only on timeframes that are at the daily level or higher (e.g., daily, weekly, monthly).
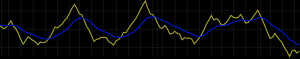
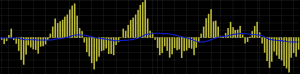
(Klinger volume oscillator shown as either a line (top diagram) or a histogram (bottom))
Calculation of the Klinger Volume Oscillator
Like most oscillators, the Klinger volume oscillator is based on taking the difference between two different moving averages (exponential moving averages (EMA) in this case).
When a shorter EMA (i.e., lower number of periods) is of greater value than a longer EMA (i.e., higher number of periods), it means that price is in an uptrend.
Shorter moving averages take into account more recent price data relative to longer moving averages, which account for data further in the past.
For example, in traditional technical analysis, a 50-period moving average breaking above a 200-period moving average is a bullish sign. This is simply due to the fact that a 50-period MA will be more reactive to current price than a 200-period MA.
Base Formula
The Klinger volume oscillator uses what’s called a “volume force”. It goes by the following formula:
Volume Force = volume * trend * temp * 100
Volume is the number of units of a security, index, currency, or contracts traded over the course of a specified period of time.
The “trend” term uses a combination of the high, open, and close of price and compares it to a previous reading of these features to qualitatively determine the trend. If the trend is positive, it is assigned a value of +1. If the trend is negative, it is assigned a value of -1.
The “temp” term is more complicated and involves multiple input variables, referred to as dm and CM. Moreover, the value of these dm and CM terms is contingent on multiple if/then statements. dm is equal to the high minus the low of price. CM is equal to the sum of the dm and the difference between the high and low of the past period. If CM is equal to zero, then temp takes on a value of -2. If CM is non-zero, then it’s equal to the absolute value of two times (dm/CM – 1).
Volume, trend, and temp are multiplied together and then multiplied by 100 to prevent the final output from being a decimal. This constitutes the “volume force”.
Taking the Exponential Moving Average of the Volume Force
Two exponential moving averages are then taken of the volume force. A 34-period EMA and a 55-period period EMA are the default settings. (The periods can be customized in your trading software.) The 55-period EMA is subtracted from the 34-period EMA.
Therefore, if the 34-period EMA has a higher reading than the 55-period EMA, the volume oscillator will be greater than zero. If the 34-period EMA is getting higher in value relative to the 55-period EMA, the oscillator will be in an uptrend.
When the 34-period EMA is lower than the 55-period EMA, the oscillator will be less than zero. If the 34-period EMA is getting lower in value relative to the 55-period EMA, the oscillator will be in a downtrend.
Uses of the Klinger Volume Oscillator
The Klinger volume oscillator is generally accompanied by a 13-period moving average (usually an exponential moving average). This doesn’t always accompany the oscillator on its own and may need to be plotted. This can be done by adding a moving average to the box that holds the oscillator.
If the 13-period EMA crosses the oscillator while it’s in an upswing, this is considered a bullish signal. If the 13-period EMA crosses the oscillator whiles it’s in a downswing, this is considered a bearish signal.
Example #1
For example, here’s this rule applied to a daily chart of WTI crude oil:
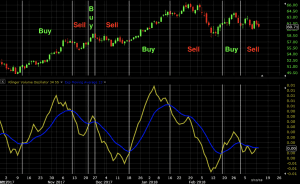
This produced seven signals. Each trade’s entry and exit is marked off by the vertical white lines. The type of trade is denoted by “Buy” or “Sell” text descriptions. It produced six winning trades and one losing trade.
Under this basic system, it’s assumed that one trade “flows” into the other. In other words, if a buy signal is produced, then that long trade stays until a sell signal comes around. By that point the long position would be closed and the short position would be initiated. In order to filter the signals to a greater extent, one would have to use different indicators. (Or different forms of technical or fundamental analysis.)
Example #2
Let’s assume we use a 50-period simple moving average to the chart. This will filter signals such that we only trade in the direction of the trend as dictated by the slope of the moving average.
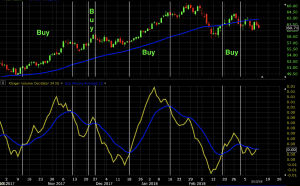
This produced a series of four winning trades in a row.
Example #3
The Klinger volume oscillator can also provide value by identifying when price and volume are moving in opposite directions. Many technical analysts believe that price follows volume. Therefore, if volume is, for example, moving up while the price is falling, it may be interpreted as a bullish sign. If volume is falling while price is still moving up, it may signal the opposite. It may be interpreted as a weak move that will eventually “run out of gas” and reverse.
If we look at the cases of divergence between price and the Klinger volume oscillator below, we can note a couple trade setups.
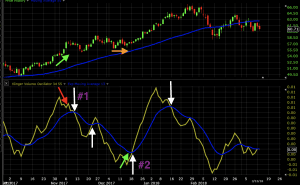
In the first (“#1”), we see price trending up and the oscillator – a proxy for volume, given that forms part of its input – trending down. When the 13-period EMA (“signal line”) crossed the oscillator while it was in a downtrend, this sent a bearish trade signal (denoted by the first white arrow). It was taken off once the 13-period EMA crossed over the oscillator while it was in an uptrend (second white arrow).
Price and the oscillator were in agreement at that point. Therefore, no trade would have been taken on the basis of divergence at the crossover that exited the short trade.
The second trade (“#2”) was a long trade. We don’t see heavy divergence, but there is some degree of it nonetheless. Price was sideways while the oscillator was sharply increasing. The trend was up based on the 50-period moving average. (This isn’t necessarily a part of the system, but the more factors you have going in favor of your trade, the better.)
Both of these trades produced nice winners.
Klinger Oscillator Histogram
The indicator also exists in histogram form. This precisely mirrors the line variation of the indicator as we can see below.
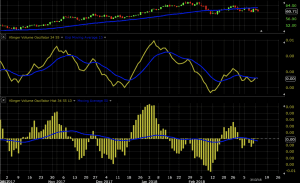
Some may simply prefer the indicator in histogram form for ease of visualization.
Conclusion
The Klinger volume oscillator is a trend reversal indicator. It relies on the concept of a “volume force”, a term unique to this particular indicator. The volume force comprises an amalgamation of factors where trend and volume are the predominant influences.
A “signal line” is generally used to confirm trade entries when it crosses with the oscillator. A cross when the oscillator is trending upward is a buy/long signal. When the oscillator is trending downward, this constitutes a sell/short signal.
For many technical analysts, any divergence between volume and price can be instrumental. If there is high volume on an asset and price is trending sideways or down, this often signifies that any ongoing downtrend could soon reverse. Likewise, if price is going up, but volume is falling, this could denote weak buying pressure.
Ultimately, the Klinger volume oscillator should be used as a confirmation tool and not as a system in itself.