Acceleration Bands


The Acceleration Bands System was introduced in 2002 by Price Headley. The concept is based on the idea of getting into a trade just as the security is trending but before its price moves heavily in one direction or another.
Top Brokers For Acceleration Band Trading

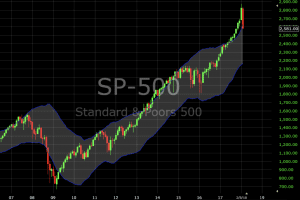
The Acceleration Bands measure volatility over a user-defined number of bars (default is often the past 20 bars). They are plotted using a simple moving average as the midpoint, with the upper and lower bands being of equal distance from the midpoint, similar to Bollinger Bands.
Here is an example plotted on a monthly chart of the S&P 500 index using the past 20 bars:
Interpretation of Acceleration Bands
The indicator uses the concept of “acceleration” to get into and out of stocks. (It, of course, can also be used on any other type of asset where charting data can be obtained.)
When price breaks the top band, this is generally an indication that the stock has broken out and thereby “accelerated”. This might be taken as a buy signal.
For those who trade options, this might be especially important. In options trading, not only is being right on a directional strategy important, but time is critical as well due to the time decay of the instrument.
When the acceleration period ends (dips back into the region between the bands), this might be taken as a signal to exit a long position.
This is inherently a momentum-based strategy. For those who buy and sell stocks primarily on value-based on fundamentals (“buy low, sell high”), buying a stock that has already made a large upward move out of the band might be taken as an indication that the stock is becoming more expensive.
But for those who take an upward breach of the Acceleration Band as a viable signal that more upside momentum is in store, it would be a buy signal. The opposite would be true for a downward breach of the bottom band, which might be interpreted a potential sell signal. It is based on the concept that volatility tends to trend over time, causing price to move in a certain direction.
Best Trading Fit for the Acceleration Bands Indicator
Stocks that might be most amenable to this type of momentum oriented trading include:
- Stocks growing earnings by 20% or more per year.
- Generally “growth” industries, such as technology or biotech.
- Stocks that tend to accelerate are likely to already be trading near 52-week highs rather than being “value” picks.
How It Works and How To Use It
As mentioned above, looking at the past 20 bars is the most common setup for this particular indicator. If one applies this to the daily chart, that includes roughly the past month’s data, given roughly 21 trading days per month. For the weekly chart, this covers 4-5 months of data. For the monthly chart, over one-and-a-half years.
Similar to Bollinger Bands, the Acceleration Bands will become wider the more volatile the stock has been and narrower the less volatile it’s been.
The indicator’s creator asserted that he interpreted a buy signal after two consecutive closes above the acceleration band. However, he said that his buy and sell signals are not based exclusively on the Acceleration Bands and other indicators and rules are used to improve the accuracy of the signals.
Once the price closes back within the Acceleration Bands, this is taken as a signal that the acceleration period is over and it’s best to close out the trade.
Acceleration Bands Example
To examine how this might have performed using the S&P 500 monthly chart above, let’s go through it, allowing for both buy and sell signals and using the indicator in isolation.
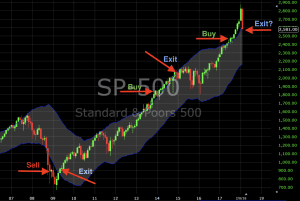
Over the past ten years using the monthly chart, we see three buy signals generated. Off the sell signal heading into the financial crisis, this trade would have roughly broken even using the signals generated using the rules from the section above. The second would have made a solid profit. The third is likely to be profitable as well.