Dollar Volume


Dollar volume seeks to track the net quantity of US dollars (or US dollar equivalents) that trade in a given day for a particular asset.
Top Dollar Volume Analysis Brokers


It is generally not displayed on anything less than the daily chart on most trading software. It will, however, work on timeframes higher than the daily chart by adding data together. Some charting software will also not log dollar volume data on some assets, particularly non-US stocks and forex.
It is generally included alongside a 50-period moving average, which can be adjusted (see chart below). This helps derive a sense of the overall volatility of that particular market as determined by money flow in and out of the asset.
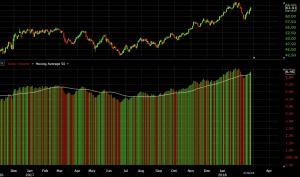
(Daily chart of WTI crude oil, with dollar volume plotted with a 50-period moving average of the indicator)
Uses of the Dollar Volume Indicator
Many technical analysts assert that price follows volume.
But some believe that looking at volume itself is flawed. For example, a metric like number of shares traded can be insufficient because it doesn’t control for price. After all, in the end it’s liquidity that moves markets, or simply dollars or money exchanging between parties.
Therefore, some might take dollar volume as a more appropriate volume indicator.
Positive dollar volume is generally denoted by a green bar, while negative dollar volume is typically marked by a red bar.
Below is a daily chart of the S&P 500 with dollar volume plotted under the price chart:
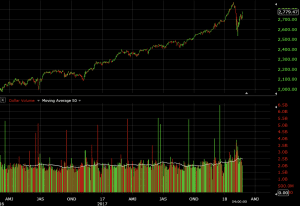
Traders might interpret several green bars in a row – especially if they’re growing in magnitude – to be bullish for future price trajectory. Contrarily, some might interpret several successive red bars to be bearish for future price trajectory.
Declining volume could be taken as a sign of a consolidating market, especially if the bars are a mix of both red and green. Traders who rely on directional movement in a market might take trades off the table in declining volume environments.
Other traders might feel comfortable profiting off markets with low volatility by using certain strategies.
Many traders also believe that volume tends to trend over time. If dollar volume is rising, this may suggest that markets are likely to have a more volatile ride going forward.
Traders who use dollar volume as a proxy for volatility may use it help determine the appropriate amount of leverage for their portfolios. In more volatile environments, using more leverage is riskier. As a “double-edged sword”, leverage both augments and worsens gains and losses, respectively.
Since fear is a stronger emotion than greed, volatility generally spikes in down markets. This causes many traders to de-risk their portfolios, which generally means cutting back on positions and/or leverage.
Traditional measures of volatility don’t discriminate between “good” volatility and “bad” volatility. Dollar volume, however, discriminates between up and down volatility through positive and negative money flows – namely, money being put into or taken out of the asset.
If a trader is traditionally bullish and dollar volume is highly positive, he or she might feel more comfortable taking a trade position, or adding to an existing one or simply letting it run. The opposite would be true if dollar volume is highly negative, as this might denote weakness in the near future.
Conclusion
Dollar volume is an alternative version of volume designed to account for money flowing into and out of an asset on a particular day (or sum of multiple days if using a larger timeframe than the daily chart).
How it’s interpreted depends on the trader and his or her beliefs. But generally sequences of positive dollar volume might indicate continuing bullish sentiment, particularly if high relative to other periods. Sequences of negative dollar volume might indicate continuing bearish sentiment. Periods of low dollar volume relative to surrounding periods or a steady mix of both positive and negative dollar volume might denote mixed market sentiment and potential further likelihood of a trendless or consolidating market.
The simple moving average that accompanies the dollar volume indicator can be interpreted as a more traditional view of volume. An upward sloping moving average denotes increasing volume. A flat moving average indicates stable volume, while a downward sloping moving average suggests declining volume.