Moving Linear Regression


Moving linear regression plots a dynamic form of the linear regression indicator.
Linear regression works by taking various data points in a sample and providing a “best fit” line to match the general trend in the data. Even if markets are up over a certain period, a linear regression line may still point down (and vice versa). This is due to the fact that most forms of linear regression are based on the mean (average) and are sensitive to outliers.
Top Moving Linear Regression Trading Brokers
-
1
 Interactive Brokers
 -
2
 NinjaTrader
 -
3
 eToro USAeToro USA LLC and eToro USA Securities Inc.; Investing involves risk, including loss of principal; Not a recommendation
 -
4
 Plus500USTrading in futures and options involves the risk of loss and is not suitable for everyone.
For example, if we look at the crude oil market over the past 50 periods, we can see that based on where the linear regression line starts and stops, the market is actually up in price over this time. However, when we plot the line, it is actually slightly negatively sloped.
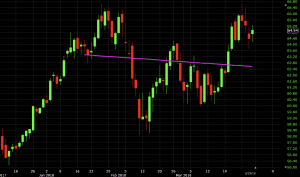
The moving linear regression will show the flow of these linear regression lines over time. The endpoints of the two lines will always meet assuming they are plotted of the same period. (In this case, both are 50 periods in length.)
Uses of Moving Linear Regression
Moving linear regression may look similar to a moving average, but differs in its calculation. Moving averages are calculated using an average of closing prices, like with simple moving averages (SMA). Alternatively, they can be calculated by assigning greater weights to more recent prices and proportionately lower weights to prices farther in the past and then averaging those together. (In this case, the most common form is the exponential moving average, or EMA.)
Moving linear regression takes a continuous series of linear regression line endpoints and joins them together.
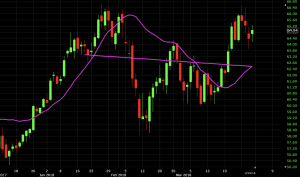
Based on these different methodologies, moving linear regression tends to hug price a lot more closely than moving averages of the same periodicity. We can observe this on the crude oil chart with the pink/fuchsia-colored linear regression line and navy simple moving average.
In certain spots, the moving linear regression line deviates from price when there is volatility and rapid shifts in the trend. This is especially true on longer periods, such as the 50-period line used in the graph above. The line will take a little while to “catch up” to price. In the end it will once the market shifts back to moving in a particular direction whether that be up, down, or sideways.
Since the SMA is an average of the past 50 candles (as shown above), and not about “best fitting” the data, it will tend to be “lazier” in following the price action.
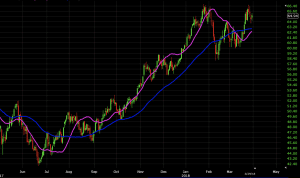
We can see this even if we tighten the period to 20.
Moving linear regression can be considered a moving average substitute. Like SMAs and EMAs, it works best in trend following systems. Moving linear averages can provide insight into a trend’s direction, magnitude, and rate of change. For trend and momentum traders, these can all be borne out with moving linear regression.
For those who trade price reversals, a crossover strategy using moving linear regression could be viable. It may even be preferable with the way moving linear regression is more responsive to price. By that thinking, reversals could be caught sooner relative to moving averages.
In the trade examples section below, we will consider applying moving linear regression to both trend following and price reversal systems.
Trade Examples
Trend Following
First, we’ll start with moving linear regression in the context of a trend following system. We’ll run it in the context of three different indicators. We’ll have the moving linear regression used alongside the Aroon indicator and a basic simple moving average (SMA).
For moving linear regression, there will be two lines – one with a period of 20 and another with a period of 100. The 20-period represents the “fast” moving linear regression line that will be more reactive to price than the “slow” line, which will be less reactive.
Therefore, if the 20-period runs above the 100-period, price will be considered in an uptrend. If the 20-period runs below the 100-period, price will be considered in a downtrend.
The Aroon indicator has two components – “Aroon up” (green line) and “Aroon down” (red line). It stands as another trend confirmation tool. The indicator denotes uptrends when the Aroon up is above Aroon down. Likewise, downtrends will be represented with the Aroon down above the Aroon up.
With this, we’ll use a 100-period SMA. This gives us a picture of the broader trend.
Our rules will be as follows:
Long Trades
- 20-period moving linear regression line above the 100-period line
- “Aroon up” above “Aroon down”
- SMA positively sloped
Short Trades
- 20-period moving linear regression line below the 100-period line
- “Aroon up” below “Aroon down”
- SMA negatively sloped
Trade Exits
- When either of the above three rules pertinent to the trade become untrue
Trend Following Example
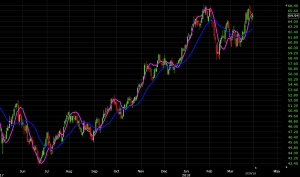
Here we have a chart of the S&P 500. With the 100-period SMA positively sloped throughout, this means we remain focused on long trades. Trade signals are generated whenever the 20-period moving linear regression (pink) line is above the 100-period line (teal) and Aroon is showing an uptrend as well (i.e., green above red). These areas are marked off by the vertical white lines below.
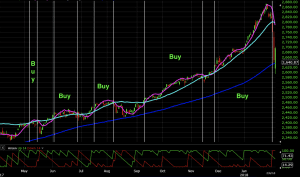
Of these five opportunities, four of them finished in-the-money and one was approximately breakeven.
Price Reversal
Moving linear regression can also be used in the context of finding price reversals in the market.
For price reversal trading, it’s generally recommended to use to shorter periods for moving average crossover strategies (and similar indicators, like moving linear regression). When the periods are shorter they are more reactive to price action and therefore more likely to diagnose reversals more quickly.
Accordingly, in this case, it’s advisable to keep the periods to 25 or under. In this case, we’ll go with a 5-period moving linear regression as our “fast” line and a 20-period as our “slow” line. The 5-period moving above the 20-period indicates a bullish crossover, while the 5-period moving below the 20-period denotes a bearish crossover.
To increase the statistical probability of any given signal, we will use Keltner channels in conjunction with the crossovers. We’ll use a 20-period setting on the channels and a 3.5x multiple on the average true range. (More information on Keltner channels and the indicator’s component can be found in this article.)
So the strategy will be to wait for a bounce off the Keltner channel to coincide with a moving linear regression line crossover in the same direction. For example, if we get a touch of the upper band of the Keltner channel – which can be interpreted as a bearish sign (price becoming stretched too far in one direction) – we will look for a cross of the 5-period (“fast”) moving linear regression line below the 20-period (“slow”).
For trade exits, we can take a touch of the middle band of the Keltner channel. (This can be plotted by going into the settings portion of the indicator on one’s charting software platform.)
Therefore, we can list out our rules as the following:
Long Trades
- 5-period moving linear regression line above the 20-period line
- Recent touch of the bottom band of the Keltner channel
Short Trades
- 5-period moving linear regression line below the 20-period line
- Recent touch of the top band of the Keltner channel
Trade Exits
- Touch of the middle band of the Keltner channel, or
- Subsequent moving linear regression line crossover, invalidating the signal
Price Reversal Example
Here we have a price reversal opportunity on the AUD/USD currency pair that fulfills the criteria of this system.
Price begins to challenge the top band of the Keltner channel, but the fast moving linear regression line remains above the slow (denoting no reversal in the trend). Price continues along the top band until the slow line moves above the fast. At this point we can enter into a short trade. (The red arrow identifies the entry while the white arrow identifies the trade exit.)
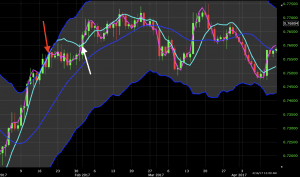
We did see a shallow move down following this entry but the uptrend continued after this point and never made it down to the midline of the channel. Once the fast line moved above the slow (representing an official resumption of the uptrend), this trade was closed out at a small loss.
In a second example, we see a similar scenario. There’s a burst of momentum that pushes price up along the Keltner channel. We see the fast moving regression line remain above the slow line, which tells us to respect the uptrend for the time being. Once the momentum ends, we see the slow regression line move above the fast where we take our short entry (red arrow).
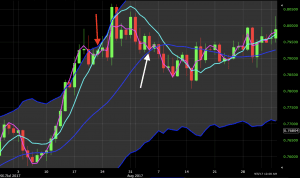
We do see more upward push into the top band of the Keltner channel following that, but price eventually retraces back down the midline of the channel. In the end, this trade roughly breaks even.
Conclusion
Moving linear regression is a trend following indicator that plots a dynamic version of the linear regression indicator. The concept is to track the trend not using basic averages or weighted averages – as in the case of moving averages – but rather by taking the “best fit” line to match the data.
Moving linear regression can be used as an alternative form of the moving average, as they are very close in terms of what they try to capture about price conceptually. They can help a trader determine where trend is going directionally, its magnitude, and the rate at which its changing.
It is most useful for traders looking to keep abreast of the prevailing trend in a market they’re trading. Those who trade reversals may also find using crossovers useful as a tool to help identify opportunities.
As always, one should never use any indicator on its own to make trading decisions. Moving linear regression should be used as part of a broader system that includes other indicators, price analysis, and/or fundamental analysis to guide trading decisions.