Moving Averages


Moving averages are the most common indicator in technical analysis. The moving average itself may also be the most important indicator, as it serves as the foundation of countless others, such as the Moving Average Convergence Divergence (MACD).
A moving average works by working to smooth out price by averaging price fluctuations into a single line that ebbs and flow with them. It is based on past prices and is therefore a “lagging” indicator. It is often used as part of trend following systems and occasionally as a support/resistance line in itself.
Brokers With The Best Tools For Moving Averages Analysis

Types of Moving Averages
Simple Moving Average
The simple moving average (SMA) and the exponential moving average (EMA) are the two most common types of the indicator.
The SMA is a basic average of price over the specified timeframe. For example, if one plots a 20-period SMA onto a chart, it will add up the previous 20 closing prices and divide by the number of periods (20) in order to determine what the current value of the SMA should be. The series of various points are joined together to form a line.
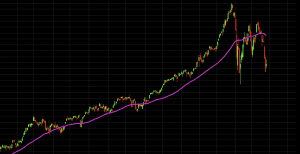
Above is an example of a 50-period SMA plotted on a daily chart of the S&P 500.
Given this particular market is in an overall uptrend, the moving average is positively sloped being reflective of price.
Moreover, price will tend to be above moving averages in uptrends as various lower prices will be baked into the reading from earlier in the trend.
For the same reasons, in a downtrend, the moving average will be negatively sloped and price will be below the moving average.
Periods of 50, 100, and 200 are common to gauge longer-term trends in the market. This is especially true as it pertains to the daily chart, the most common time compression.
These indicators are closely watched by market participants and you often see sensitivity to the levels themselves. A decisive break of a well-followed moving average is often attributed importance by technical analysts.
A crossover of a “fast” SMA above or below a “slow SMA” may also denote an official change in trend. In the context of 50-200 period moving averages, the 50-period would be considered fast as it’s more responsive to price.
The 200-period is slow, as it’s less responsive. The 100-period would be considered slow relative to the 50-period but fast relative to the 200-period.
Exponential Moving Average
The exponential moving average (EMA) is preferred among some traders. Unlike the SMA, it possesses multiplying factors that give more weight to more recent data points than prior data points. As a result, the EMA will react more quickly to price action. This can give a trader an earlier signal relative to an SMA.
Similar to SMAs, periods of 50, 100, and 200 on EMAs are also commonly plotted by traders who track price action back months or years.
In terms of short-term moving averages, the 12- and 26-day EMAs have been popularized by the MACD indicator.
EMAs tend to be more common among day traders, who trade in and out of positions quickly, as they change more quickly with price. EMAs may also be more common in volatile markets for this same reason.
Triple Exponential Moving Average (TEMA):
Taking the DEMA one stage further, this is a standard EMA combined with a smoothed version of that EMA and a smoothed version of THAT resulting EMA, (all with the same lookback period).
It is designed to reduce still further the lag time between market prices and the MA.
The buy and sell signals are the same as with other MAs with the same pros and cons as with all Moving Averages.
As with the DEMA, a longer period TEMA may be needed, even if the trader is primarily focussed on short tern trading, as there are likely to be multiple false signals in ranging markets.
Double Exponential Moving Average (DEMA):
Introduced in 1994, by Patrick Mulloy, it is a combination of a traditional EMA and a smooth version of that EMA, resulting in an even faster reaction to market prices than the EMA itself.
As with other moving averages it is used to generate buy/sell signals on moves above/below that DEMA and, if use in combination, as a trend reversal system using MA crossovers as the buy/sell signal, in addition to identifying support and resistance in trending markets.
Clearly, as there is less lag relative to prices the noise/signal ratio worsens, with more false breaks.
To reduce this phenomenon, a longer DEMA (e.g. 100 days) might be more useful, though there is no ideal solution to this dilemma. Again, this is a trend following indicator and is thus less useful in rangebound markets.
Uses of Moving Averages
Since moving averages are lagging indicators, they shouldn’t be misinterpreted as tools that can predict future price movements with any degree of resolution.
For example, by the time a moving average goes from being sloped in one direction or another to flattening, the price action has usually already changed due to the moving average’s lagging nature.
For those who depend on support and resistance strategies (or as part of a strategy) to generate entry points, if you’re also waiting on a moving average crossover to confirm the signal you’ll have probably already missed it. (Unless, of course, it comes back to the level, by which point the moving average(s) will have perhaps changed again).
Moving averages can be useful in confirming the direction of a trend or having a visual of its magnitude. But it should have an ancillary role in an overall trading system.
Some traders use them as support and resistance levels. And some combine various moving averages and use crossovers of different ones to confirm trend shifts and entry points. But like all indicators, there should be confluence among different tools and modes of analysis to increase the probability of any given trade working out.
Moving averages are most appropriate for use in trending markets. Traders will pay attention to both the direction of the moving average as well as its slope and rate of change. Trend changes and momentum shifts can be easily picked up in moving averages and can often be seen more easily than by looking at price candlesticks alone.
Oftentimes traders will trade only in the direction of the trend as determined by the moving average, or a set of them. For example, if 50-, 100-, and 200-period moving averages are all in alignment as positive sloped, the trader may bias all his or her positions to the long side.
Trade Examples
As mentioned in the previous section, moving averages themselves are best not used in isolation to generate trade signals on their own.
Therefore, the system will rely on moving averages. But it will also be applied in the context of support and resistance. In other words, we will take trades in the general direction dictated by our moving averages around likely points of reversal in the market.
Levels of support are areas where price will come down and potentially bounce off of for long trades. Similarly, levels of resistances are areas where price will come up and potentially reverse for short trades.
Our moving averages will be applied using a crossover strategy. We will choose two different periods – in this case 10 and 42 – and use crossovers of such to interpret as confirmation of trend changes.
Why 10 and 42? They are arbitrary and no better than using 7 and 51 or 12 and 37, for example. But 10 periods, when applied to the daily chart, can be interpreted as encompassing the past two weeks of price data. (There are five days per trading week.) Forty-two periods accord to roughly two months of price data, as there are approximately 21 trading days per month.
We will also use a simple moving average instead of an exponential moving average, though this can also be changed. The 10-period SMA will be our “fast” moving average, as it will be more reactive to price than our 42-period “slow” SMA. When price is in an uptrend, the fast SMA will follow price up faster than the slow EMA.
Therefore, when the 10-period SMA crosses above the 42-period SMA, this will be a bullish sign. We will then be biased toward long trades. When the 10-period SMA crosses below the 42-period SMA, this will be interpreted as a bearish sign. We’ll then be focused more toward short trades.
So to list our rules out:
Long Trades
- 10-period SMA above 42-period SMA
- Bounce off a recent support level, as identified using prior price history
Short Trades
- 10-period SMA below 42-period SMA
- Bounce off a recent resistance level, as identified using prior price history
Trade exits
- When the moving averages cross back over to invalidate the trend or
- A break of the support or resistance level of interest
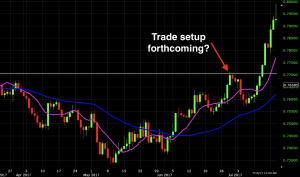
We’ll apply this system to the AUD/USD currency pair.
Trade #1
The AUD/USD starts seeing resistance right around the 0.77 level. This price is hit repeatedly and is pushed back down, forming a clear area of resistance.
Therefore, as soon as we see a touch of resistance, and a change in trend – i.e., fast SMA running below the slow SMA – we will take a short trade.
We see this and identify the spot below with the red arrow. The candle on which this change is confirmed will be the one correspondent to the crossover.
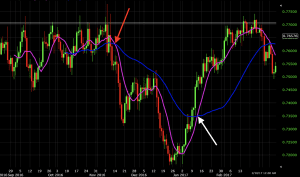
The trade is closed out once the trend is confirmed to be over, as indicated by the white arrow. Overall, this trade went from 0.7550 to 0.7500 for about a 0.7% gain.
Trade #2
We see the same type of setup after this – a bounce off 0.7700 and a bearish SMA crossover giving the signal to enter short.
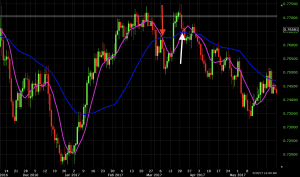
The down move ended up being fairly shallow and price climbed back up to the resistance level where another crossover was generated. This trade finished roughly breakeven or for a very small loss.
Trade #3
Once again, the same setup – bounce off 0.7700 and bearish SMA crossover.
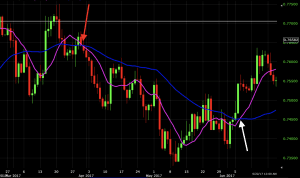
Here we did see a sustained drop in price and were able to wrap up about a 1.3% profit.
Trade #4(?)
The 0.7700 level did hold again, but only temporarily.
Price bounced off 0.7700 to 0.7600, but had enough momentum to finally break the 0.7700 level upward. Our SMAs were helpful in this context as it showed that no downward trend had been established according to the periods used. Thus no trade was initiated.
With all these setups, some might say that once you get into the trade, you’ve already forfeited a notable portion of the down move waiting for the moving averages to cross. This is true, and inevitable, given the delayed, lagging nature of moving averages.
One solution would be to shorten the periods of the moving averages such that they react faster, hug price more tightly, and remain closer to the resistance level. This would have the impact of identifying setups sooner.
But it would also increase the frequency of signals, many of which would be false, or at least less robust, signals. Like many things, there is a trade-off to be considered when adjusting the periods of the moving averages.
This is merely an example of one way moving averages can be employed as part of a trading system. Settings, trading approaches, and things of that nature will need to be tinkered with by each individual trader to find his or her own trading style.
Conclusion
The moving average is an extremely popular indicator used in securities trading. It can function as not only an indicator on its own but forms the very basis of several others.
There are numerous types of moving averages. There is the simple moving average (SMA), which averages together all prices equally. The exponential moving average (EMA) weights only the most recent data.
Moving averages work best in trend following systems. When used appropriately, they provide easy insight into a trend’s direction, its magnitude, and its rate of change. However, for those who prefer to trade price reversals, using moving average crossover strategies is perfectly viable as well.
Moving averages should nevertheless never be used in isolation for traders who solely trade off technical analysis due to their lagging nature and should be used as part of a broader system.