Derivative Oscillator


The derivative oscillator blends the concept of double smoothed relative strength index (RSI) with the graphical representation of the moving average convergence divergence (MACD) indicator. It represents an attempt to improve on the predictive ability of the RSI and MACD individually and has both price reversal and trend following properties.
The Best Derivative Oscillator Analysis Brokers

Calculation of the Derivative Oscillator
The derivative oscillator is calculated in multiple steps.
It begins with the calculation of the RSI. The RSI is then smoothed by taking an exponential moving average of itself. Then it is double smoothed by taking an exponential moving average of the original smoothing. A “signal line” is formed by taking a simple moving average of the RSI. The derivative oscillator is then found by taking the double smoothed RSI and subtracting the signal line.
Mathematically:
1. RSI = 100 – 100/(1 + RS)
RS = Average Gains / Average Losses
Average Gains are computed as the average price change for the positive price bars in the data sequence included.
Average Losses are computed as the average price change for the negative price bars.
A simplified RSI is equal to:
Simplified RSI = Gains / (Gains + Losses)*100
Gains are equal to the sum of the positive price bars. Losses are equal to the sum of the negative price bars.
2. Next, we need to apply an exponential moving average (EMA) to the RSI.
Smoothed RSI = EMA(RSI)
Double Smoothed RSI = EMA(Smoothed RSI)
3. Next, we form a “signal line”, which is the equivalent of a simple moving average (SMA) or the double smoothed RSI.
Signal Line = SMA(Double Smoothed RSI)
4. Finally, we can produce the final calculation with the two end elements we’ve calculated. The derivative oscillator becomes the difference between the double smoothed RSI and the signal line.
Derivative Oscillator = Double Smoothed RSI – Signal Line
How to Use the Derivative Oscillator
The use of the derivative oscillator is straightforward. If the oscillator is positive, this is considered a bullish sign. If it is negative, this is a bearish sign.
Crossovers of zero denote a potential trade signal. If the value of the derivative oscillator is running from negative to positive (up-sloping), this is taken as a bullish signal. If the value is running from positive to negative (down-sloping), this is taken as a bearish signal.
The strength of certain trends can also be determined by looking at the magnitude of the various bars. The greater the positive magnitude of a bar, the greater the strength of the uptrend. The greater the negative magnitude of a bar, the greater the strength of the downtrend.
Examples
S&P 500 Daily Chart
Below we see an example of the derivative oscillator using a basic price chart of the S&P 500 on the daily chart. Each of the vertical white lines denotes a crossover of the derivative oscillator. If using the oscillator alone as a trade signal device, it implies that one should always be in a trade on a market, as it’s always either bullish or bearish.
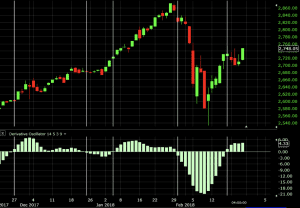
The first signal is bullish, depicting where one would take a buy/long trade. This yielded a profit of about 80 points, or 3.08% (308 basis points).
At the second vertical line, this flipped to a bearish signal. This denotes going short while also taking off the long position from the previous signal. This lost 20 points, or 147 bps.
At the third line, we close the short and open a long. This gained 100 points, or 368 bps.
At the fourth line, we close the long and open a short. This lost about 90 points, or 320 bps.
At the fifth line, we close the short and open a long. This is currently still open and up roughly 20 points, or 73 bps.
Overall, this particular strategy over this timeframe – roughly two months of S&P 500 data – made 90 points, for about a 3.5% gain (350 bps). This of course would exclude any transaction costs or matters related to the bid-offer spread.
EUR/USD 30-Minute Chart
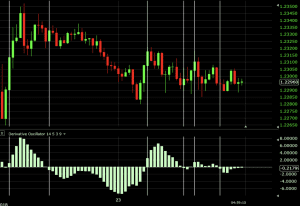
The first vertical white line provides a bullish trade. This captures about 20 pips after the beginning of the second vertical line provides a signal to exit the trade and begin a short.
The second vertical line begins the second trade (a short), running to the third line. This gains about 15 pips.
The third trade, a long, running from the third to fourth lines, loses about 20 pips.
The fourth trade, a short, from the 4th to 5th lines, loses about 12 pips.
The fifth trade, a long, from the 5th to 6th lines, loses about 15 pips.
The sixth and final trade, a short, from the 6th line forward, is currently at breakeven.
Thus, the system applied over this data would currently be at a net loss of about 12 pips.
Conclusion
The derivative oscillator is designed to improve on the relative strength index (RSI). It is similar in graphical design to a MACD histogram.
Some traders like its versatility given it has both trend following and trend reversal elements.
A crossover of the zero line is considered a bullish signal (if going from negative to positive) or bearish signal (if going from positive to negative). The magnitude of the bars above or below zero indicates the strength of the trend.
Though the examples presented above offer a simple system, trade decisions should ideally be made on a range of factors. One indicator is generally never sufficient in isolation. Looking for confirmation across more than one indicator while looking at support and resistance or candlestick patterns will increase the odds of a trade working in one’s favor. Combining these elements with fundamental analysis can, of course, be even better.