Price Percent Oscillator (PPO)


The price percent oscillator (PPO), also known as the percentage price oscillator, measures momentum. Like many indicators in technical analysis, its foundation is based on the moving average, which is used to show how price trends change over time.
The Top Brokers For PPO Analysis
-
1
 Interactive Brokers
 -
2
 NinjaTrader
 -
3
 eToro USAeToro USA LLC and eToro USA Securities Inc.; Investing involves risk, including loss of principal; Not a recommendation
 -
4
 Plus500USTrading in futures and options involves the risk of loss and is not suitable for everyone.
A moving average, as explained in more detail in this article, takes previous closing price data over a certain amount of time and averages out that information to show a trend. The PPO relies on an exponential moving average (EMA), meaning that recent price data is weighted more heavily, and in exponential fashion.
A long EMA will provide more gradual movements, as more price data is captured within it. A shorter EMA will shift more rapidly and converge to the intraday price movement as the period shortens. Any EMA should be of appropriate length such that it captures the relevant trend while eliminating random noise.
Calculation of the Price Percent Oscillator
The PPO is a close cousin to the moving average convergence divergence (MACD) indicator and uses the same EMAs to calculate it. Namely, it takes the difference between the 26-period and 12-period EMAs. Back when the trading week was six days, 26 days represented a full trading month as this was considered a way to look at the intermediate trend in the market. The 12-period EMA historically represented two trading weeks.
The indicator is calculated based on the following formula:
(12-period EMA – 26-period EMA) / (26-period EMA)
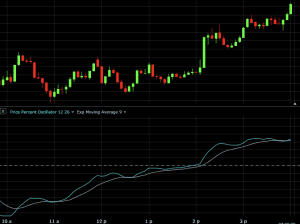
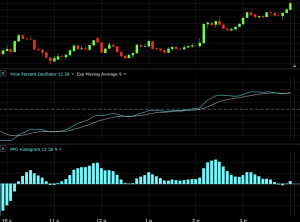
A 9-period EMA (grey line below) is typically taken of the 26-/12-period differential EMA (teal line) to track its trend. This is often called the “trigger line” as some traders use it to generate signals. For example, if the 26/12 line moves above the trigger line, this is considered a bullish signal (i.e., positive momentum). Likewise, a cross of the 26/12 below the trigger line may be interpreted as a bearish signal (i.e., negative momentum).
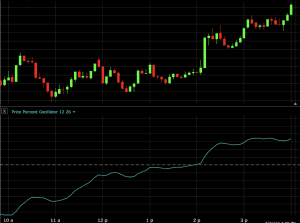
It is not strictly necessary to plot the 9-period EMA along with the PPO itself as it doesn’t help significantly in identifying the trend. It is perfectly okay to plot the PPO by itself and can perhaps simplify things (see image below). It’s of course entirely up to the individual. Some use the spread above or below the 9-period EMA to track momentum. That is, if the 26/12 line is above the 9-period EMA and that gap is growing larger, this means momentum is positive and growing.
A rising 26/12 line denotes that momentum is increasing; namely, the 12-period EMA is rising faster than the 26-period EMA. This makes sense as the 12-period EMA will be more sensitive to price changing than the 26-period EMA (because the former contains less price data and thus factors less into its calculation).
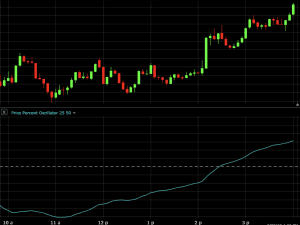
It should be noted that one can alter the periods of the EMAs used to calculate the PPO. The 26-/12-period configuration is standard but choosing a different set is perfectly reasonable as well. The longer the periods, the smoother the indicator will appear. For example, here’s a 50-/25-period set:
And here’s a (noticeably choppier) 5-/15-period set:
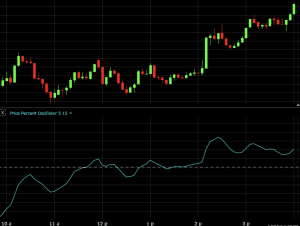
Changing the moving average calculation from exponential to simple can also smooth out the trajectory as well.
Price Percent Oscillator Histogram
Instead of lines, some prefer to visualize the PPO as a histogram instead. The PPO histogram measures the distance between the 26/12 line and the 9-period EMA. For example, if momentum is positive, the histogram will show a value above zero. If momentum is positive and growing, the histogram will take on higher values.
The PPO histogram is especially helpful for those who generate trade signals based on crosses of the trigger line, which is the traditional use of the indicator. Those who use the PPO line itself to track momentum may not find it useful.
Trading the Price Percent Oscillator
As a momentum indicator, the PPO is generally best used alongside other momentum indicators. Blending it with contrarian indicators that are designed to trade price reversals, like Keltner channels, would give conflicting signals and finding trade setups would be rather difficult.
Using other momentum indicators, such as the simple moving average, is a viable way to help track the overarching long-term trend that may not show up in the PPO, which tracks more intermediate trends.
The idea in such a strategy would be to have both momentum indicators (or however many indicators are used) line up at the same time. If the moving average is positively sloped and the PPO histogram possesses a positive value, these are both bullish signals and would support long trades. Likewise, if the moving average is negatively sloped and the PPO histogram has a negative value, this setup would bias one toward short trades.
We can find examples of trade setups on this particular one-hour chart of the S&P 500. There’s a negatively sloped (i.e., bearish) 200-period simple moving average, which biases the trades toward the short side.
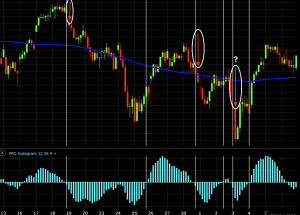
We have three setups where each trade is taken at the first price candle after the PPO histogram goes negative. (If gauging this using the standard PPO format (lines instead of the histogram), this would be shown as the 26/12 line moving below the trigger line.) Each prospective short trade is denoted by a downward pointing red arrow circled in white. The trade is exited once the PPO switches from positive to negative (shown by the second vertical white line).
The third trade is marked by a question mark (?) to show that this one is really a judgment call, given the 200-period moving average had begun to flatten out and isn’t showing a clear trend either way.
This is merely one example of how to combine indicators as part of a trading strategy or system. In general, no indicator should be used to trade by itself. Rather, one should use a broader consortium of technical indicators and analytical methods to best arrive at one’s trading decisions.
Conclusion
The price percent oscillator is part of the momentum family of indicators. It can be viewed in one of two ways – the two separate lines that comprise it or as a histogram. When the indicator is increasing in magnitude, this means momentum is moving higher and a potential opportunity for trend-following traders.
The PPO can also serve as a generalized volume indicator. Greater fluctuations and higher peaks and troughs in the PPO indicate higher volume. This can provide meaningful information for traders who believe in the idea that “price follows volume”.
As always, never trade individual indicators in isolation. They are best used as part of a broader analytical framework.