Fisher Transform


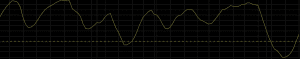
The Fisher Transform transfigures price into a Gaussian normal distribution. The indicator is typically used to identify “overbought” and “oversold” market conditions and thus is designed to ascertain potential reversal points in the market.
The Top Brokers For Fisher Transform Trading
-
1
 Interactive Brokers
 -
2
 NinjaTrader
 -
3
 eToro USAeToro USA LLC and eToro USA Securities Inc.; Investing involves risk, including loss of principal; Not a recommendation
 -
4
 Plus500USTrading in futures and options involves the risk of loss and is not suitable for everyone.
Price is transformed into a normal distribution – commonly referred to as a “bell curve” – where the tail ends of the distribution are thin (namely, the probability of them occurring is theoretically low). This means large swings or extreme values in the indicator should be uncommon.
Therefore, when this does occur, it may be taken as an indication that a price reversal could be in store. For this reason, traders often value the Fisher Transform for its ability to identify potential price reversals in real time rather than the signals generated by lagging indicators. The sharper, more distinct peaks of the indicator unambiguously portray these signals.
Accordingly, it can make for more efficient mechanical trading decisions for those who choose to go that route in their trading.
The Fisher Transform can also be applied to other technical indicators such as the moving average convergence divergence (MACD) and relative strength index (RSI) as an attempt to enhance the predictive capacity of reversals in these indicators. But most charting software has it inbuilt for price only.
Calculation of the Fisher Transform
The Fisher Transform is calculated as:
Fisher Transform = ½ * ln [(1 + X) / (1 – X)]
Where:
ln denotes the shorthand form of the natural logarithm.
X represents the transformation of price to a level between -1 and 1 for ease of calculation
Trade Examples of the Fisher Transform
Fisher Transform signals can come in the form of a touch or breach of a certain level. For those who take this approach, the thinking is that if one waits for evidence that the indicator has peaked, one has likely missed any potential reversal in price in the asset itself. What this particular level happens to be will be dependent on the market being traded, the timeframe to which the indicator is applied, and is up to the discretion of the trader.
Or prospective trade signals can come from a reversal in the indicator itself. Instead of abiding by a certain breach of a level, one could simply take a trade after the Fisher Transform changes direction. Ideally, like all indicators, this signal wouldn’t be traded in isolation, but due to a confluence of supportive factors, such as the alignment of other technical indicators, price and candlestick patterns, and/or fundamental analysis.
We will look at how the indicator would have worked on a daily chart of the S&P 500.
We’ll take trade signals based on the following rules:
Long trades
- Fisher Transform must be negative (i.e., the more negative the indicator is, the more “stretched” or excessively bearish price is)
- Taken after a reversal of the Fisher Transform from negatively sloped to positively sloped (i.e., rate of change from negative to positive)
Short trades
- Fisher Transform must be positive (i.e., price perceived to be excessively bullish)
- Taken after a reversal in the direction of the Fisher Transform
But as we can see below, if we use the indicator in isolation on this particular market – the S&P 500 mapped onto a daily chart – it doesn’t work that well. Buy (“long”) and sell (“short”) trades are marked between the white vertical lines. The close of the candle marked by the white line to the left marks the opening of a trade while the close of the candle denoted by the white line on the right marks the exit of a trade.
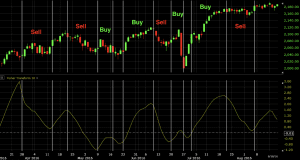
This would have produced four winners and four losers and roughly broken even profit-wise.
If we revise the system to include the rules above but this time take trades only in the direction of the prevailing trend – as dictated by a 50-period moving average – we see greater accuracy.
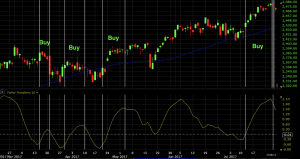
The first trade is a loser. The second roughly breaks even. The third and fourth are winners.
Other indicators can of course be added to the system as the individual trader sees fit.
Criticism of the Fisher Transform
Financial data tends to be a poor fit for the normal distribution. Some markets, such as developed market equities, tend to be directional and go up over time to reflect the cash-producing nature of corporations. (Stocks represent ownership in a company and are designed to reflect the value of the cash flow returned to owners of the company over time.)
Normal distributions are symmetrical around the mean. Even markets such as precious metals, despite being non-cash producing assets, still rise by around the rate of inflation (mostly US CPI data, since these commodities are most commonly priced in US dollars) are slightly directional over time rather than symmetric in their price moves.
Moreover, financial data tends to be more dispersed, meaning the “tails” of the curve tend to be fatter relative to a normal distribution. In one sense, assuming financial markets follow a normal distribution can be dangerous, as it can lead the trader to underestimate the probability of outliers.
Conclusion
The Fisher Transform transfigures price into a Gaussian normal distribution and pinpoints potential price reversals in the market.
The unambiguous nature of the signals highlights the benefits of the approach. The downside is that applying the normal distribution to financial data is of only tenuous accuracy and is an oversimplification.
To better the accuracy of the Fisher Transform, it should be used in tandem with other indicators and analytical methods.