Pivot Points


Pivot points are one of the most widely used indicators in day trading. The tool provides a specialized plot of seven support and resistance levels intended to find intraday turning points in the market.
The Best Brokers For Pivot Point Analysis Trading
-
1
 Interactive Brokers
 -
2
 NinjaTrader
 -
3
 eToro USAeToro USA LLC and eToro USA Securities Inc.; Investing involves risk, including loss of principal; Not a recommendation
 -
4
 Plus500USTrading in futures and options involves the risk of loss and is not suitable for everyone.
Below is a view of how they appear on a one-hour chart of the AUD/JPY currency pair. All seven levels are within view.
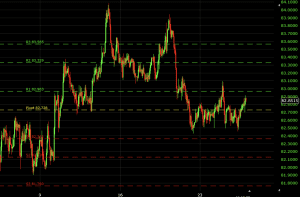
While traders often find their own support and resistance levels by finding previous turning points in the market, pivot points plot automatically on a daily basis. Since many market participants track these levels, price tends to react to them.
Calculation of Pivot Points
Pivots points can be calculated for various timeframes in some charting software programs that allow you to customize the indicator. For example, some programs may allow you to calculate pivots points for a weekly or monthly interval. But the standard indicator is plotted on the daily level.
The central price level – the pivot point – is calculated as a function of the market’s high, low, and close from the previous day (or period, more generally). These values are summed and divided by three. This is the same concept as the “typical price”.
Pivot Point = [High (previous) + Low (previous) + Close (previous)] / 3
The other six price levels – three support levels and three resistance levels – all use the value of the pivot point as part of their calculations.
The three support levels are conveniently termed support 1, support 2, and support 3. The three resistance levels are referred to as resistance 1, resistance 2, and resistance 3. You may also see them called by their shorthand forms – S1, S2, S3, and R1, R2, R3, respectively.
These values are calculated as follows:
- Resistance 1 = (2 x Pivot Point) – Low (previous period)
- Support 1 = (2 x Pivot Point) – High (previous period)
- Resistance 2 = (Pivot Point – Support 1) + Resistance 1
- Support 2 = Pivot Point – (Resistance 1 – Support 1)
- Resistance 3 = (Pivot Point – Support 2) + Resistance 2
- Support 3 = Pivot Point – (Resistance 2 – Support 2)
Since the price levels are based on the high, low, and close of the previous day, the wider the range between these values the greater the distance between levels on the subsequent trading day. Likewise, the smaller the trading range, the lower the distance between levels will be the following day.
It should be noted that not all levels will necessarily appear on a chart at once. This simply means that the scale of the price chart is such that some levels are not included within the viewing window.
Uses of Pivot Points
Pivot points were initially used on stocks and in futures markets, though the indicator has been widely adapted to day trading the forex market.
Pivot points have the advantage of being a leading indicator, meaning traders can use the indicator to gauge potential turning points in the market ahead of time. They can either act as trade entry targets themselves by using them as support or resistance, or as levels for stop-losses and/or take-profit levels.
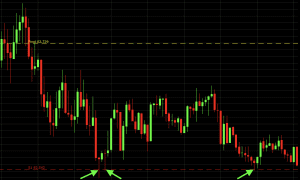
For example, below we can see multiple cases of S1 acting as support.
The pivot point, being the middle line and the level off which everything else is calculated, is the primary focus. If price is trading above the pivot point, market sentiment might be considered bullish for the day (even though it’s still possible for a market to be down for the day if this is true).
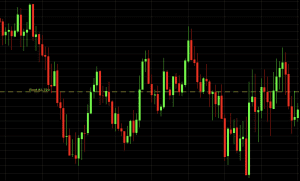
If the market is flat, price may ebb and flow around the pivot point. We can observe this type of price behavior in the chart below.
Though R1, R2, and R3 are termed in the sense that they may likely act as resistance as the market rises, if price runs above them they can also act as support if price were to move down. The same holds true for S1, S2, and S3, which can act as resistance on any move back up when they break as support.
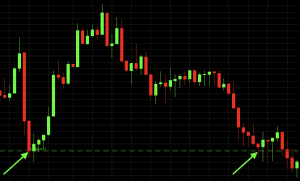
For instance, here we see a resistance level acting as support.
Using Pivot Points for Gauging Probabilities
Pivot points are also used by some traders to estimate the probability of a price move sustaining itself. Though it depends on the market, the following probabilities are generally reported in terms of how likely price is to close the trading day above or below the following levels:
- Closes higher than R1 40% of the time
- Closes lower than S1 40% of the time
- Closes higher than R2 15% of the time
- Closes lower than S2 15% of the time
- Closes higher than R3 5% of the time
- Closes lower than S3 5% of the time
These, of course, are simply rough approximations. Simply because price is moving above or below the outer levels doesn’t necessarily mean the moves aren’t valid or sustainable. For example, it should never be assumed that, based on the above information, that you have an 85% chance of winning a trade if you take a long position when price hits S2. That certainly will not be true on its own.
Pivot Points as Stop Losses
Some traders will take trades at a level, expecting a reversal on the touch, while using the next level below it (in the case of a long trade) or above it (in the case of a short trade) as a stop-loss.
For example:
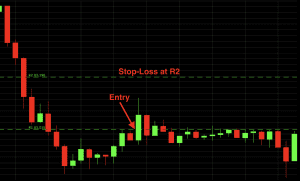
Here we see a short entry at R1 and a stop-loss at R2.
Trading Using Pivot Points
At this point, it should seem fairly straightforward that pivot points are used as prospective turning points in the market. Taking trades at these levels in the direction of the expected reversal is a very common technical strategy.
To improve the viability of this strategy, traders will tie the pivot points strategy to other indicators. For instance, one might use a 50-period simple moving average to gauge the trend and bias one’s trades only in the direction of that trend.
Moreover, instead of taking the first touch of a pivot level, one might require a secondary touch for confirmation that the level is valid as a turning point. Below is an example of why “confirming” the validity of a level is best before taking a trade on a basic touch. This is a five-minute chart of the EUR/USD.
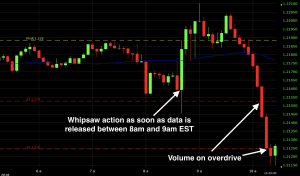
When data or news is coming out, volume markedly picks up and the previous trading movement and intraday support and resistance levels can quickly become obsolete. On the big green bar, price did indeed hold between the two pivot levels. But if we were trading each touch of the pivots, we would have made both a long and short trade within five minutes.
After that point, the market became firmly bearish and fell steadily, showing no sensitivity to pivot points.
So you need to be careful and make sure you aren’t trying to trade levels that the market has no intention of respecting when big volume is present in the market.
If we were to write out our rules for this system:
1. a) If the 50-period simple moving average is positively sloped, take long trades only.
b) If the 50-period simple moving average is negatively sloped, take short trades only.
2. Take trades upon a secondary touch of the pivot level after first affirming that the primary touch is a rejection of the level.
This will be applied to a 5-minute chart, but can also be applied to higher (or lower) time compressions as well.
For day traders, who use daily pivot points, using the 5-minute to hourly chart is most reasonable. Swing traders might use weekly pivot points would be best to apply the strategy on the four-hour to daily chart. Position traders would probably best be suited to use monthly pivot points on either the daily or weekly chart.
But this is a fairly simple system that can be effective.
Example
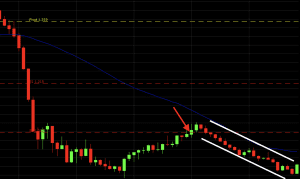
Here we have a 5-minute chart of the EUR/USD currency pair.
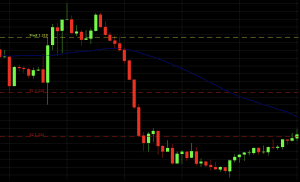
Price is in a downtrend for the day, price bounces off the S2 level (acting as resistance) once upon the retracement, leading to a short trade upon a secondary touch of S2.
This trade worked itself out well, after continuing the downtrend shortly thereafter.
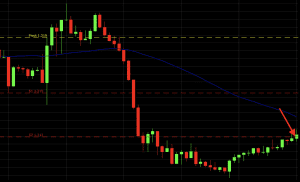
Now, of course, the question is, how do you determine where to get out?
Before placing a trade, you have to have an exit plan. This can take multiple forms.
Several options are displayed in the diagram below.

A level of resistance forms shortly after the trade begins moving in our direction. Naturally, expecting resistance to form there again in the future can be reasonable.
Moreover, if price begins consolidating and any momentum in the trend – or volume in the market as a whole – has faded, then we can simply choose to exit the trade then.
Or we can take a touch of the moving average. Some traders use some of the more popular moving averages – 50-, 100-, and/or 200-period – as support and resistance levels or consider a change in the trend if price were to get above whichever moving average is being tracked.
A natural take-profit in a pivot points system is also, of course, at the next level in the hierarchy. In this case, if we’re taking a short trade at S2, our take-profit level might be S3. But as aforementioned, getting to the outermost levels, like S3 and R3, is generally rare.
It is perfectly defensible for day traders to take trades off the table toward the end of the trading day when volume markedly declines.
A Word on Time Zones
It should also be noted that pivot points are sensitive to time zones. Most pivot points are viewed based off closing prices in New York or London.
Therefore, someone using charting software using a closing time based in San Francisco or Tokyo or some other time zone may have different pivot points plotted on their chart that may not be followed on any large scale internationally. This could potentially render them of muted or no value.
Accordingly, it’s recommended that your charting times are set to either New York hours or London hours. How these relate to GMT or UTC specifically depends on where each is in the calendar, as both cities employ daylight savings time.
Whichever time zone you choose, know that pivot points can be backtested by going through previous price data. It is important to ensure that price is sensitive to these levels in the market you’re trading.
Conclusion
Pivot points provide a glance at potential future support and resistance levels in the market. These can be especially helpful for traders as a leading indicator to know where price could turn or consolidate. They can also be used as stop-loss or take-profit levels.
While daily pivot points are the most common and most appropriate for day traders, some charting platforms will allow you to plot them for other timeframes as well (e.g., weekly, monthly).
As with all indicators, they should not be used as the only thing that you’re basing your trades on. They should be used in addition to other forms of analysis and/or other technical indicators.