Percent Volume Oscillator (PVO)


The percent volume oscillator (PVO) measures the change in volume through two moving averages.
There is both a “fast” and “slow” moving average. The fast moving average uses a lower period, and is thus more reactive to changes in volume. The slow moving average uses a faster period and is therefore less reactive.
Top PVO Brokers
-
1
 Interactive Brokers
 -
2
 NinjaTrader
 -
3
 eToro USAeToro USA LLC and eToro USA Securities Inc.; Investing involves risk, including loss of principal; Not a recommendation
 -
4
 Plus500USTrading in futures and options involves the risk of loss and is not suitable for everyone.
These two moving averages are then subtracted from one another.
The rate of change in volume will ebb and flow over time. Namely, volume can’t exponentially increase or decrease over sustained periods of time. Accordingly, the indicator will be cyclical, or oscillate, over time.
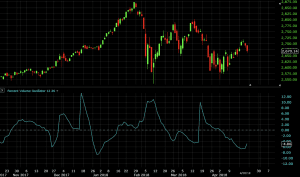
Here is a depiction of the PVO on its own, continuously moving up and down based on changes in volume in this particular market.
Generally, there is also a second line plotted along with the PVO, which is an exponential moving average of the PVO itself. In other words, if PVO is thought of as similar to the first derivative of volume – i.e., the rate of change in volume – then the exponential moving average of PVO can be interpreted as roughly the second derivative of volume, or the rate of change in the rate of change in volume.
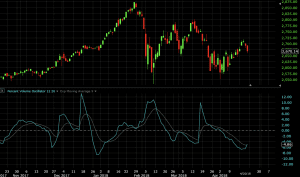
Some use the exponential moving average of the PVO, while others don’t use it. The default settings of charting software generally include it, but it can be removed.
The PVO will only work on markets where volume data is recorded. This means that on certain markets and certain charting timeframes, the PVO will not plot due to a lack of associated volume. For example, on many charting platforms, volume data is only aggregated for individual stocks. And volume may not be collected on some markets (e.g., stock indices) on charting timeframes lower than the daily level.
Settings of the Percent Volume Oscillator
The default settings of the percent volume oscillator are equivalent to those of the MACD. They can, of course, be adjusted to one’s preferences. The default has the fast moving average set to 12 periods and the slow moving average set to 26 periods.
These settings go back to several decades prior when the trading week was six days. Therefore, 12 periods represented two weeks while the 26 periods represented one month’s worth of data.
The 9-period exponential moving average would represent a week-and-a-half’s worth of data.
Shorter settings are best for short-term traders. For example, 5-period for the fast moving average and 21-period for the slow moving average would make the PVO more sensitive and cause choppier behavior and/or more frequent oscillations.
For longer-term traders, a 21-period for the fast moving average and 42-period for the slow moving average might be more appropriate. This causes a smoother trajectory.
Interpretation of the Percent Volume Oscillator
Volume is the number of shares (or quantity of a certain market item) bought within a specified period of time. For instance, Apple (AAPL) generally trades at between 30-40 million shares per day. For volume itself, there is no weighting criteria or mathematical formulas involved, and is thus one of the easiest indicators to understand.
Volume is widely tracked among many technical analysts – and market participants more broadly – as volume is often presumed to preceded price moves. For example, if the market is moving down and there’s a large swell in volume, this may indicate that buyers are coming into the market to eventually push price back in the other direction.
With respect to the PVO, a positive value shows that the recent trend in volume’s rate of change is positive. This may imply that there is enough support among traders to keep price moving in the direction of the prevailing trend. If there is no trend in volume’s rate of change, one could soon develop.
On the other hand, a negative value means that the rate of change in volume is declining. This could suggest that the declining volume could have the effect of inducing a stagnation or reversal in price.
Market moves that lack an attendant amount of volume are often viewed as having low credibility. For many chartists, this implies that a turn in the market could be ahead.
The PVO helps accomplish this task by viewing volume through its rate of change.
How to Use the Percent Volume Oscillator in Your Trading
The percent volume oscillator isn’t a tool you would want to use to base trading decisions off of by itself.
Rather, it can help you better determine the validity of certain price movements. An easy “warning” spot in the market is when prices are falling or rising despite falling or weak volume.
Example #1
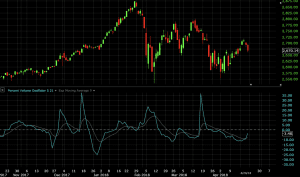
Let’s look at an example on a daily chart of the S&P 500, where we look at the period highlighted between the two vertical white lines:
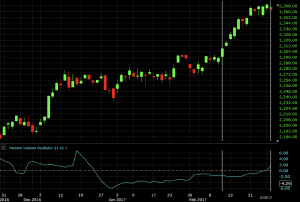
Before this, we see negative PVO values (volume declining), but this is normal as price is consolidating over this range.
However, as soon as we hit the point demarcated by the first white line, we notice that price begins rising as volume continues to fall. Halfway through this range, we see the rate of change in volume start to become less negative (though still declining nonetheless). By the end volume starts to gradually increase again. Throughout this, we should be skeptical of this move, though the PVO itself doesn’t provide any insight as to when there will be a prospective turn in price.
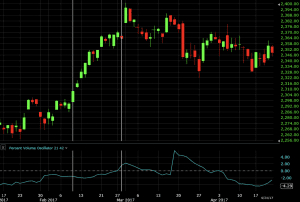
After this upturn – low volume increases in a market are often called a “melt up” – we do see a downward move in prices. It takes approximately a month for the market to get back to its former highs.
Example #2
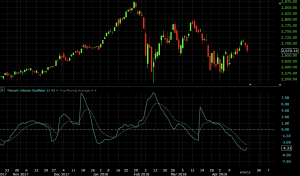
This chart, also a daily time compression of the S&P 500, was shown above, and is being used again as it’s basically a perfect example.
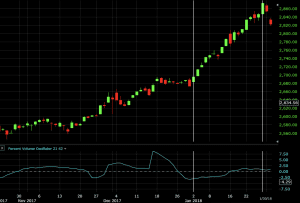
The market melts up by over 7%, which is a huge move on net declining volume. Any time something like this is occurring it generally ends up with a move back in the other direction on increasing volume.
As it eventually did:
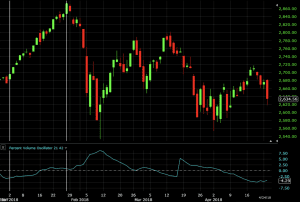
It is rare that “melt ups” or “melt downs” reach their conclusion by either a) seeing a continuation of the price move through higher volume or b) seeing a reversal of the price move through continued lower volume.
Instead, they generally end by a price move back in the other direction on an increase in volume.
Overall, the PVO is more of a “risk off” indicator rather than one we can use to time trade entries.
Conclusion
The percent volume oscillator helps traders determine how price could move as a consequence of the underlying rate of change in volume.
We can deduce a few rules with respect to volume’s rate of change as it relates to price.
1. If price is moving in one direction or another and this is accompanied by declining volume (i.e., values below zero on the PVO), this trend is generally believed to lack credibility.
2. If price is trending is one direction or another and is accompanied by increasing volume (i.e., values above zero on the PVO), the trend is generally believed to be legitimate.
3. If price is consolidating and volume is increasing, a material price move could be forthcoming. We can’t tell from volume itself in which direction this price move might go.
4. When trends in either direction become overextended, the PVO should reverse direction itself. This means that if a market is rallying on low volume, the PVO is likely to accelerate to a positive (or more positive) value. If a market is rallying on high volume, once the move has run its course, the PVO is likely to decelerate to a negative or less positive value.
5. If we wanted to express a lot of this in terms of “mathematical equations” as it pertains to market prices it would look as such:
- Declining volume + increasing prices = bearish
- Rising volume + decreasing prices = bearish
- Declining volume + decreasing prices = bullish
- Rising volume + increasing prices = bullish
The PVO itself, however, is not something that can be used to time trade entries but rather warn traders of unsustainable market behavior.