Money Flow Index


The money flow index (MFI) measures momentum in a security by showing the inflow and outflow of money into a security over time.
The indicator is synonymous with “volume-weighted RSI” as it integrates volume and mirrors the relative strength index (RSI) with respect to its mathematical formulation and categorical classification as a momentum oscillator. Both price and volume data are part of its calculation.
The Top Money Flow Index Analysis Brokers
-
1
 Interactive Brokers
 -
2
 NinjaTrader
 -
3
 eToro USAeToro USA LLC and eToro USA Securities Inc.; Investing involves risk, including loss of principal; Not a recommendation
 -
4
 Plus500USTrading in futures and options involves the risk of loss and is not suitable for everyone.
Calculation of the Money Flow Index
The money flow index is standardized to a 0 to 100 scale. The indicator’s default setting is set to 14 periods and is usually applied to the daily chart, which is the most popular time compression among chartists. Volume is often not kept on charting software platforms below the daily level, so the MFI may need to be used on the daily time compression or higher (e.g., weekly, monthly).
Step One
Like some other indicators, the MFI relies on a calculation of the typical price. This is calculated as follows:
Typical price = (High price + low price + close price) / 3
(Other indicators that use the typical price include the commodity channel index and Keltner channels.)
Step Two
After that, we calculate what’s called raw money flow (or simply money flow), which is a function of both volume and the typical price.
Money Flow = Volume x typical price
Step Three
The next step involves the ratio between the positive and negative money flow. This calculation is equal to:
Money Flow Ratio = (N-Day Positive Money Flow) / (N-Day Negative Money Flow)
N will be equal to the number of periods the indicator is set to. If kept to the default settings, N will be 14.
Positive money flow is calculated by taking the sum of all the money flows on all the days in which the typical price of one day is above the previous day. Likewise, negative money flow is calculated taking the sum of all money flows on the days in which the typical price of one day is below the prior day.
Step Four
With those three calculations, the money flow index can be found according to the following formula:
Money Flow Index = 100 – 100 / (1+ money flow ratio)
As aforementioned, this value will always come to a value between 0 and 100.
It should be noted that on many charting platforms volume data is not kept for currency pairs. Without volume, the money flow index will not plot on the charts accordingly.
Use of the Money Flow Index
Traders who use volume in their analysis often look for divergences between volume and price. If volume is trending one way, while price is trending in the opposite direction, it could be a leading indication of an upcoming change in the direction of the market.
Many technical analysts believe that price follows volume. Therefore, if volume is trending down while the price trend is up, some traders will believe that price is likely to reverse trend to eventually match volume. Since the MFI integrates volume data into it, traders may attribute meaning to divergence between the direction of the indicator and price.
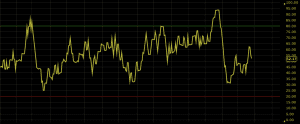
On the MFI, you can notice that there are green and red horizontal lines on the chart. The green line occurs at 80 while the red line occurs at 20. It is believed that when the MFI runs above 80 a security is “overbought” while when the indicator is below 20 a security is “oversold”.
Based on these two levels, traders would be biased toward long trades when a market is oversold and toward short trades when a market is overbought. Price reversals are, of course, based on the premise of mean reversion or distorted markets eventually working their way back to normality. If there is a divergence between the MFI and price and this favors the trade – e.g., market overbought, price trending up, but MFI trending back down – this is even better.
The MFI should nonetheless never be used on its own as a trade signaling mechanism, and would be used in conjunction with other indicators, tools, and modes of analysis to make better informed trading decisions.
Trade Examples
The following provide some trade examples of how the money flow index might be used to identify potential trading opportunities. I have paired it with Keltner channels, which is another price reversal indicator.
The MFI is used with a 14-period setting, while the Keltner channels are set with a 20-period setting and a 3.0x average true range multiple. (The higher the average true range multiple the wider the bands will be, and therefore the more conservative the trade signals will be.)
Given that both the MFI and Keltner channels are price reversal indicators, it doesn’t make sense to plot trend following indicators on the chart in conjunction with them (other than for perhaps general information).
The System
We can form a basic trading system around this.
Long trades will be taken when the following are true:
- Security is oversold based on the money flow index running below 20
- Touch of the bottom band of the Keltner channels.
Short trades will be taken when the following are true:
- Security is overbought based on the money flow index running above 80
- Touch of the top band of the Keltner channels
Exit trades when:
- When price touches the middle band of the Keltner channels (a middle band can be plotted on this indicator by going into the settings on your charting software)
This is simply an example of a basic system that uses technical indicators only. It ignores price action, chart patterns, and fundamental analysis.
Money Flow Index + Keltner Channels Work Best on Volatile Securities
All of the following trade examples will be used on Kinder Morgan (KMI) stock. For the money flow index and Keltner channels to initiate signals, the security needs to exhibit a sufficient amount of volatility.
Some assets, like short-term investment-grade/sovereign bonds and diversified stock indexes, rarely exhibit enough volatility to trigger signals when using the money flow index and Keltner channels on the settings listed above.
One option is to simply relax the settings to trigger more signals. For example, one could use a smaller period on the MFI (e.g., 7-day, 10-day) to generate more signals or use a 25-75 band instead of 20-80 band for oversold/overbought readings. Moreover, on the Keltner channels, one could also use a shorter period or lower the average true range multiple. The issue with doing this, however, is that if the criteria is relaxed too heavily, then the signals may become less statistically significant in terms of finding quality reversal points in the market.
With a volatile stock like KMI, one should be able to generate potential trade setups based on the stipulated criteria.
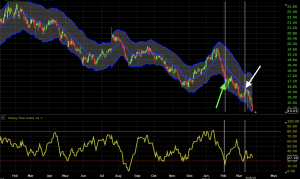
Trade #1
The first example is a long trade where we see both a move below 20 on the money flow index, denoting “oversold” and a touch of the bottom band of the Keltner channels.
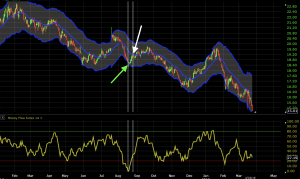
Here this trade ended up nailing the bottom of the ongoing down move. Trade entry is identified by the upward pointing green arrow. The touch of the middle band of the Keltner channels represents the trade’s exit, which is defined by the white arrow. This trade made about a 4.2% profit.
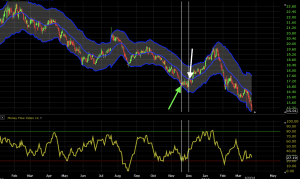
Trade #2
This is a similar setup to the first where we are betting on a reversal in the trend. Price comes down to a point where it triggers an “oversold” reading in the MFI and a touch of the bottom band of the Keltner channel. We enter at that point for about a 3% profit once the trade is exited on a touch of the channel middle band.
Trade #3
Here we get probably our best trade setup of the ones listed. It’s a short trade in the context of the broader downtrend.
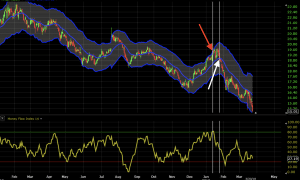
Price came up to the point of being both overbought according to the MFI and touched the top band of the Keltner channel. Once again, the trade was exited upon a touch of the middle band of the channel. This made a little over a 3% profit.
Trade #4
Here we took a third long trade. However, after a slight initial bounce, we did not get our exit signal (touch of the middle band). It fell a bit before eventually closing out according to this rule at a loss of 2.3%.
Overall, this system would have produced a net gain when aggregating the results of all four trades.
Conclusion
The money flow index is a momentum indicator that provides insight into how much money is flowing in and out of a security over time. It is designed for traders looking for points of price reversal in a market and would not be a relevant addition to a trend following system.
It is recommended that the MFI be used in tandem with other price reversal indicators (e.g., Fisher Transform, Keltner channels, Klinger volume oscillator) to filter false signals and better its accuracy.