Mass Index


The Mass Index studies the difference between high and low prices in a security over time. It is considered a study on volatility. Once the Mass Index moves above a certain level, then drops back below, it is commonly interpreted that a trend change could be forthcoming.
The Best Brokers For Mass Index Analysis
-
1
 Interactive Brokers
 -
2
 NinjaTrader
 -
3
 eToro USAeToro USA LLC and eToro USA Securities Inc.; Investing involves risk, including loss of principal; Not a recommendation
 -
4
 Plus500USTrading in futures and options involves the risk of loss and is not suitable for everyone.
Like most technical analysis indicators, it was initially designed for the daily chart, though traders are entirely free to use it on any timeframe.
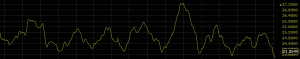
(General display of the Mass Index)
Calculation of the Mass Index
There are four steps to calculating the Mass Index:
- Calculate a 9-day exponential moving average (EMA) of the difference between high and low prices for any given period.
- Calculate a 9-day EMA of the moving average produced in step one.
- Divide the EMA produced in step one by the EMA produced in step two.
- Add the values in step three for the intended number of periods.
In step four, the number of periods, by default, is generally set to 25. Therefore, one is typically summing a series of 25 periods to come up with the calculation. This can be adjusted in the settings of the charting software.
Interpretation of the Mass Index
The indicator’s developer Donald Dorsey suggested that once the Mass Index runs above 27, then drops back below 26.5, this could be an indication that the trend could reverse course.
These levels, of course, can vary depending on the market traded. A reading of 27 on the Mass Index would denote a fairly volatile security. Naturally, some are more volatile than others. A more volatile security may require a higher threshold than 27 to achieve the same interpretation. Likewise, a less volatile security may require a lower threshold.
The Mass Index is unique in that it seeks to identify potential reversal points in the market outside of the standard analytical techniques of transforming price and volume. Though a trading range may be associated with price and volume, the Mass Index relies on trading ranges that aren’t exclusively focused on the direct value of one or the other.
Moreover, while the Mass Index may indicate a potential trend change, it says nothing about what its direction might be. For this reason, the indicator should be used in conjunction with other tools – technical indicators, candlestick patterns, fundamental analysis – to better gauge where price is likely to go and protect against false signals.
Trade Examples
Let’s say we apply the Mass Index using the default settings. The Mass Index should not be used in isolation, so must be used as part of a broader system. Therefore, let’s use it in the context of pairing it with a moving average crossover technique in order to generate our trade signals.
We will use a 50-period simple moving average (SMA) and a 21-period SMA to generate signals.
- When the 21-period (“fast”, orange line) SMA is above the 50-period (“slow”, blue line) SMA this will define for us an uptrend.
- When the 50-period (“slow”, blue line) SMA is above the 21-period (“fast”, orange line) SMA, this will define a downtrend.
Therefore, if we receive a confirmation signal from the Mass Index, we would wait until the SMAs cross over in order to produce our trade entry signal.
To ensure that our signal is still reliable, we could institute a rule saying that any trade needs to be taken with the trend, as denoted by both the fast and slow SMAs.
Namely, if both are positively sloped, we would be biased toward long trades. If both are negatively sloped, we would be biased toward short trades.
For simplicity, we will only take these trades upon the original rules delineated by the indicator’s developer. Namely, if the Mass Index moves above 27 and subsequently falls below 26.5, we will take a trade in whichever direction is dictated by the SMAs as described above.
The System
So to list things out, this is our system:
1. If the Mass Index rises above 27, then falls below 26.5 we would be on the lookout for trend reversals.
2. If the slow (higher-period) SMA is above the fast (lower-period) SMA we would wait for a subsequent cross (i.e., fast SMA above slow) to take a long trade. Vice versa for short trades.
3. We would only take long trades if both the slow and fast SMAs are positively sloped. We would only take short trades if both the slow and fast SMAs are negatively sloped.
Example #1
If applied to a daily chart of the S&P 500, we have the following:
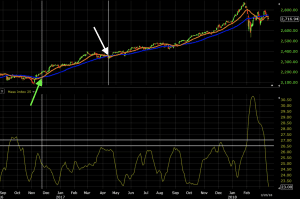
Let’s explain what this all means.
1. On the Mass Index (bottom chart), the horizontal white lines show where the 27 and 26.5 levels are. To get a signal, as mentioned, we need a climb above 27 on this indicator and a fall below 26.5. In this case, since the slow SMA was above the fast SMA – denoting a downtrend – we would take a trade in the event of a trend reversal when the SMAs cross again.
2. Both the slow and fast SMAs are positively sloped, which confirms the bias toward long trades. We would take a trade once the fast SMA crosses above the slow SMA as confirmation that the trend has changed to bullish (i.e., a long trade).
3. This eventually does occur and now fulfills all three criteria. This level is shown by the vertical white line on the price chart and occurs about a month after the Mass Index breaks below 26.5.
Once the trade is set in motion, as soon as the moving averages cross over again to confirm a shift in the trend, this trade is closed out as it invalidates the long trade signal. This is marked by the white arrow. The level at which this trade would have been closed out is shown by the correspondent vertical white line. This trade would have made a respectable profit.
Later on, we have the same situation. The Mass Index makes a big move above the 27 level. It eventually comes back down below 26.5. The slow SMA is above the fast SMA so we would wait for the SMAs to cross again in order to take a long trade. This trade has yet to materialize.
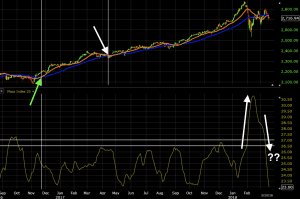
Once the SMAs re-cross and if both are positively sloped, we would head into another long trade.
Example #2
Here we have a chart of the currency pair AUD/USD. We see two trade setups:
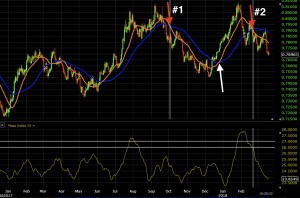
Trade #1
1. In the first case, we first start out with the Mass Index running above 27. It subsequently runs below 26.5, leading us to look out for a trend shift.
2. The trend is positive – fast SMA above slow SMA, with both moving averages positively sloped. This leads us to look for a trade entry once the SMAs cross and are both negatively sloped for a short entry.
3. We eventually receive this signal. The beginning of the short trade is marked by the downward pointing red arrow.
We exit this trade upon a subsequent crossover of the SMAs, as marked by the white arrow.
Trade #2
In the second case, we simultaneously get everything we need.
After the Mass Index gets above 27, we get a downward move below 26.5 at the exact time of the trend change. The fast SMA crosses below the slow SMA to show the beginning of a downtrend while both SMAs are negatively sloped.
This trade would still be open. As has been the standard approach to exiting, we would wait for a subsequent crossover over of the SMA to confirm that the trend has shifted. So far the trade has been going in favor under this approach.
Conclusion
The Mass Index looks to identify potential price reversals in a market by analyzing its trading ranges.
It is calculated by taking an exponential moving average of trading ranges and dividing it by double exponential moving average, then summing up the totals over a specified period.
When the Mass Index increases, it indicates that the high-low trading range is widening, meaning the asset is becoming more volatile.
An indication of a potential trend reversal was originally characterized as a break above the 27 level and then back below the 26.5 level.
The Mass Index provides no indication of the future trajectory of the trend – if a shift is indeed in store – whether that means going from positive to negative, sideways to positive, positive to more positive, and so forth. It is also prone to false signals. This means it must be used in conjunction with other indicators to improve the accuracy of any trading system in which it’s employed.