Level II Market Data and the Order Book


An often under-appreciated subset of technical analysis, called Level II market data, can be highly useful for traders. Level II market data shows a broader range of market orders outside of basic bid, ask, and market prices. Namely, it extends on the information available in the Level I variety.
So what are level II quotes?…
Level II data is also known as “market depth” by showing the number of shares, contracts, or lots available at each individual price.
In addition, it is commonly referred to as the order book, given it shows a range of orders that have been placed and are waiting to be filled. Orders are filled whenever buyers and sellers in the market agree to transact at a given price.
Leading Brokers
-
1
 Interactive Brokers
 -
2
 NinjaTrader
 -
3
 eToro USAeToro USA LLC and eToro USA Securities Inc.; Investing involves risk, including loss of principal; Not a recommendation
 -
4
 Plus500USTrading in futures and options involves the risk of loss and is not suitable for everyone.
Key Takeaways – Level II Market Data and the Order Book
- Level I data shows the best bid/ask, sizes, and last trade price/size. It’s the standard info most traders see.
- Level II data (market depth/order book) expands this by showing multiple bid and ask levels from different market participants.
- It reveals how much size is sitting at each price. This helps traders gauge support, resistance, and liquidity.
- Market makers appear in Level II, showing who provides liquidity by posting buy/sell quotes.
- Level II often costs extra for stocks/futures, while many forex brokers provide it free. (It depends.)
- Tape reading uses Level II plus time and sales to judge whether buyers or sellers have real control.
- Traders watch order flow, liquidity shifts, and absorption to anticipate short-term moves.
- Best for active day traders and scalpers in liquid markets.
Level I Market Data
Level I data includes the following:
- Bid price: The highest price a market participant is willing to buy an asset or security at.
- Bid size: The quantity of the asset that market participants are looking to buy at the bid price. This can include the number of shares (e.g., stocks), contracts (e.g., futures), or lots (e.g., forex). Sometimes this number is divided by 100 (and sometimes a different figure) simply to shorten the number of digits that need to be used.
- Ask price (also known as the offer price): The lowest price a market participant is willing to sell an asset or security at.
- Ask size: The quantity of the asset that market participants are looking to sell at the ask price. This can include the number of shares, contracts, or lots.
- Market price (sometimes last price): The price at which the last trade settled.
- Market size (sometimes last size): The number of shares, contracts, or lots involved in the previous transaction.
Traditional technical analysis, which involves trading based on price action or indicators that involve transformations of price and/or volume, relies on Level I data.
Standard Level I data can typically be viewed within your broker. For example, here is Level I data on Google (GOOG) stock:
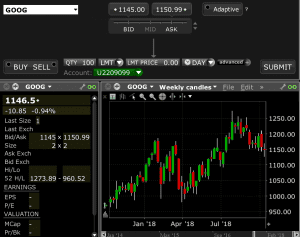
This shows the bid, ask, current market price, current size (bid and ask size both approximate 200 shares, as denoted by the “2×2”)
Level II Market Data (Market Depth / Order Book)
Level II data includes multiple bid and ask/offer prices. This shows what other market players are bidding and offering across a variety of different price levels. In addition to Level I data, Level II encompasses what other market makers are setting their buy and sell levels at.
What are market makers? They are securities or assets dealers who provide liquidity to the market by being willing to buy and sell at specific prices at all times.
For most traders, Level I data will be available to you through your broker. And often, but not always, for free.
For those who depend on more in-depth data, such as what kind of order size is located at what prices, they will need to have Level II data. This is often provided by brokers at a charge. It may be free or it may not be available on some brokerages altogether.
Level II data is generally more expensive than Level I data on stock and futures trading platforms. It is regularly free on many forex brokers.
For an example of the difference between Level I and Level II data, let’s say you’re trading a stock with a market price of $25.00; the bid is $24.98 and the ask is $25.02. This is standard Level I data.
Level II would include a list of bid and ask prices up and down the ladder. For instance, you might see bid prices at $24.95 and $24.92 with more size than you see at the regular Level I bid and ask prices at $25.05 and $25.08. Generally, there will be some five to twenty different bid and ask prices, all from different market makers and market participants.
What Are Level II Quotes?
Below is a list of the information included in Level II data:
- Multiple bid prices: Level II data encompasses the bid from Level I data as well as all other bid prices below this figure. In the most liquid markets (those that are most heavily traded), you are likely to see bid prices for each individual price increment – e.g., for each $0.01 in a large cap stock. If assets or securities have large bid/ask spreads – i.e., the difference between the bid and ask is 0.1% or more the price of the security – they are also likely to have sizable gaps in the bid and ask spreads in the market depth data.
- Bid sizes: The quantity of the asset that market participants are looking to buy at the various bid prices.
- Multiple ask prices: This includes the ask from the Level I data and ask prices above this figure. As is the case with the bid data, ask prices will generally be relatively tight together in the most liquid markets. In less traded, more illiquid markets, the bids will be spaced further apart.
- Ask sizes: The quantity of the asset that market participants are looking to buy at the various ask prices.
Example of Level II Market Data
This shows an example of Level II data for a NASDAQ stock:
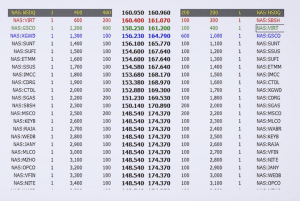
The very top of the chart show the bid (160.950) and ask (160.960) prices, or standard Level I data.
Level II data includes the bids all the way down on the centre left-hand column and the asks all the way down on the centre right-hand column.
To the immediate left of the bid prices (column starting with 160.950) is the size, or number of shares, being offered at that level.
The next column over is the cumulative size. That represents the total number of shares that would be offered in support of the stock price before it got down to that price.
The same is done over on the ask side (the right-hand side).
The very far left and right columns represent different market makers.
Many traders like looking at the cumulative number of shares being offered at each level. If there is an imbalance, that may denote which side the market is leaning toward with respect to a particular security or asset. Traders may also look at the size being offered at the bid and ask to obtain a general understanding of where the market is likely to head.
In this particular example, there are more shares being offered on the ask side (left-hand side), denoting that buyers are, in effect, more powerful than sellers. Accordingly, this might inform a trader of a bullish bias insofar as the Level II data / order book wager into the decision-making process.
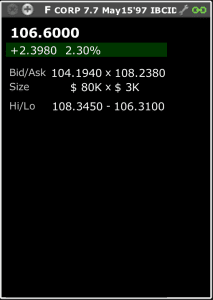
In terms of further examples, but relying on Level I data alone, below we see a Ford (F) bond where the size is $80K at the bid and $3K at the ask. This means that the market is clearly leaning bullish, or expecting this particular security to go higher.
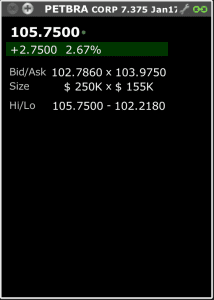
We see the same on the following Petrobras (PETBRA) bond where the size is $250K at the bid and $155K at the ask. Bid outweighing the ask represents a bullish market.
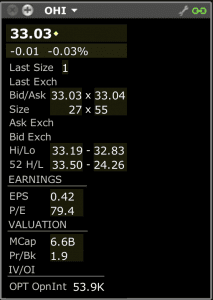
On Omega Healthcare Investors (OHI) stock you can see about twice as much size at the ask than the bid. This denotes a more bearish slant.
Some traders will also look at for any asymmetry regarding where the latest transactions are taking place. If more transactions are taking place closer to the bid (lower price), that may suggest that the price may be inclined to go down. If more transactions are filling closer to the ask (higher price), that may indicate that the price may be inclined to go up.
None of this, of course, is foolproof. Orders may come in at any time to influence a market’s direction.
Tape Reading
Tape reading in the context of Level 2 data is the practice of studying the live order book and time and sales feed to anticipate very short-term price moves.
As mentioned, Level 2 shows the depth of the market by listing all active buy/sell orders across various price levels, while the tape shows the actual trades that are going through in real time.
A trader who tape reads is trying to understand the interaction between orders waiting to be filled and orders that are actually executed.
The main goal is to see which side of the market (buyers or sellers) is showing real strength.
If traders keep aggressively hitting the ask – meaning they are willing to pay the seller’s price to get filled quickly – that suggests buying pressure. If the opposite is happening, with constant selling into the bid, it suggests selling pressure.
How Does Liquidity Behave?
A tape reader also pays close attention to how liquidity behaves.
A large bid order sitting in the book might look like support, but if it disappears just before price touches it, the order may have been fake, intended only to influence other traders.
On the other hand, if the same order keeps reappearing after being hit, it could signal an iceberg order, where a large participant is quietly buying or selling more than they show.
Absorption
Another important element is absorption.
This happens when price repeatedly hits a level but fails to move through because someone is absorbing all the orders on the other side. That can mean a big institution is building a position.
Traders also watch how quickly trades print on the tape.
If orders are flying through at increasing speed, momentum is likely building. If the tape slows down with smaller sizes, it often signals a pause or exhaustion in the move.
Overall
Tape reading can give a skilled trader an edge by giving an idea of the immediate balance of supply and demand before it shows up on a candlestick chart.
It’s best in liquid markets like index futures or large-cap stocks where order flow is deep enough to study. It nonetheless has limitations.
Algorithms and high-frequency trading often mask true intentions, and it takes a lot of practice to avoid misreading what’s happening.
For that reason, tape reading is considered an advanced skill, most useful for scalpers and day traders looking to take advantage of small intraday price shifts.
Drawbacks of Level II Data
Market Noise and Complexity
Level II data can be overwhelming, especially for new traders.
The order book updates constantly, with quotes often changing multiple times per second.
This constant movement creates “noise” that makes it difficult to separate meaningful activity from random order flow.
Spoofing and Fake Liquidity
Large bids or asks can appear in the book only to vanish before being executed.
High-frequency traders often use this tactic, known as spoofing, to trick others into believing there is real buying or selling interest.
This makes Level II data less reliable as a standalone signal.
Hidden Orders and Icebergs
Not all liquidity is visible. Institutions often use iceberg orders, where only a fraction of the true size is genuinely shown.
As a result, traders relying solely on Level II may misjudge the actual depth of supply or demand.
Limited Predictive Power
Level II shows where orders are now, not where they will be.
Orders can change instantly. Accordingly, what looks like support or resistance at one moment may disappear the next.
It provides short-term insight but doesn’t provide guarantees (like anything else).
Extra Cost and Access Restrictions
For many stock and futures brokers, you might see that Level II data comes with additional fees.
Some brokers provide only Level I unless traders pay for a data package. This can be a barrier for beginners or smaller accounts.
Less Useful in Illiquid Markets
In thinly traded securities, Level II data often has wide spreads and sparse information.
This makes it harder to interpret order flow accurately compared to highly liquid markets like large-cap stocks or index futures.
Conclusion
Level II market data, also known as “market depth” and the order book, look at bid and ask prices and sizes beyond the bid and ask prices nearest the market price in Level I data.
Day traders may receive both Level I and Level II market data through their brokerage. Level II data should be available for stocks and futures trading.
However, there may be an additional charge for this. Some provide Level I and Level II data for free, but may compensate by charging higher commissions per trade.
Many forex brokers offer Level II market data, but some do not. Many will give you only Level I data and a charting platform.
Level II data is usually not used in isolation as a trading strategy. Day traders will generally use it in conjunction with technical analysis strategies or along with fundamental analysis. But it can be an additional form of analysis to help better inform trading decision-making.