How To Trade Momentum In Technical Analysis


In technical analysis, momentum typically refers to the rate of change in a security’s price. It may also refer to the rate of change in a security’s volume. Given that neither price nor volume can accelerate in one direction in perpetuity, momentum is considered an oscillator.
Top Brokers For Momentum Trading
-
1
 Interactive Brokers
 -
2
 NinjaTrader
 -
3
 eToro USAeToro USA LLC and eToro USA Securities Inc.; Investing involves risk, including loss of principal; Not a recommendation
 -
4
 Plus500USTrading in futures and options involves the risk of loss and is not suitable for everyone.
The rate at which price or volume change will ebb and flow over time. When price is in an uptrend, the momentum indicator will be predominantly positive. When price is in a downtrend, the indicator will be mostly negative.
In fundamental analysis, momentum can also refer to changes in a company’s revenues or earnings. It generally has a positive connotation in this respect (strong growth in one or both).
For purposes of this article, however, we will focus on momentum with respect to its meaning and use in technical analysis.
Calculation of Momentum
The momentum indicator is generally done with respect to its price. In most charting platforms that will be the case, though some developers will design momentum indicators as they pertain to volume.
But as commonly defined for purposes of this indicator, momentum is the change in a N-period simple moving average (SMA) over a specified period of time.
Momentum = SMA(now) – SMA(N-periods ago)
The longer the period, the smoother the indicator will appear.
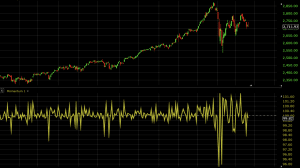
For example, if we use the momentum indicator on a daily chart of the S&P 500, a 1-period momentum indicator (top chart) will be all over the map relative to a 50-period (bottom chart).

The indicator is often set to a baseline of 100 in its reading. So if the indicator is above 100, this denotes that the trend’s rate of change, on net, is increasing. If below, this means the trend’s rate of change is decreasing over the specified period.
Use of the Momentum Indicator
When momentum reaches a certain “extreme” level, traders may consider this level of momentum to be unsustainable and use it as a price reversal indication. No indicator should be used to make trade decisions on its own. So if it is used for purposes of finding price reversals in the market, it should be paired with 1-2 others to get better readings.
If a momentum indicator is applied to highly speculative assets (e.g., cryptocurrencies), it may not function as well when there is a wide range of opinion regarding the valuations of these assets. When there are assets of this nature, this can create price bubbles or very erratic trading behavior. Just because momentum has breached a certain level doesn’t mean it’s bound to retreat back under it in due time. As the saying goes, “the market can stay irrational longer than you can stay solvent”.
At the same time, there is a lot of polarity among traders and investors on how to use momentum. “Momentum trading” or “momentum investing” refers to trading in the direction of the momentum itself.
It’s a form of trend following or “riding the wave”, and seeks to capitalize mostly on traders’ emotions or a stark re-rating in the valuation of a particular asset due to a catalyst. It’s a very short-term strategy that often discards fundamental analysis entirely.
Though the traditional approach of investing, in particular, is to “buy low and sell high”, the momentum approach equates to either “buy high and sell higher” or “sell low and sell lower”. It’s believed that trading securities while they’re moving the fastest is the best time to make money in them.
Analogy to Physics
The thinking behind it can be analogized as follows. If a car is accelerating from being completely idle, its acceleration (rate of change of velocity) is getting higher but its velocity is still low. This would be akin to a security whose momentum is increasing but its price has yet to move too materially in one direction or another.
At some point during the trip, the car will stop accelerating and it will be at this moment that it is moving the fastest. This is the equivalent to when price will be moving the fastest in a security. For the momentum trader, this inflection point would be the ideal time to get in a long trade – right as it’s moving the fastest but before it slows down and reverses course.
Trade Examples
Since there are two ways to interpret momentum – either as a price reversal indicator or a “trade with the trend” tool, I will provide examples of each.
Let’s start with its use as a price reversal indicator.
Price Reversal Strategy
The momentum indicator should be paired with another tool to help filter false signals and improve their statistical accuracy. For this purpose, we can pair it with another price reversal indicator. For our purposes, let’s use the Keltner Channels. The Keltner Channels, as explained in more depth in this article, use the touch of the top and bottom bands in order to find areas where price could be statistically likely to reverse.
When both indicators promote price reversal signals simultaneously, we’ll take a trade in the intended direction. But first we need to establish what these rules are.
For the momentum indicator, we can plot it and observe where it’s rarely been historically. For example, let’s say our momentum indicator is standardized to 50 periods on the daily chart of the S&P 500. Over the past couple years, it’s rarely trended above 106 and below 100.
We can keep this six-point spread symmetrical based on trend. In other words, if we’re in an uptrend, we can take price reversals (i.e., short trades) based on a touch of 106 (or higher) on the momentum indicator and a touch of the upper band of the Keltner Channel. If we’re in a downtrend, we can take price reversals (i.e., long trades) based on a touch of 94 (or lower) on the momentum indicator and a touch of the lower band of the Keltner Channel.
For an exit signal on long trades, we can take a touch of the 100-period simple moving average (SMA) or a move below 106 on the momentum indicator. For an exit signal on short trades, we can take a touch of the 100-period SMA or a move above 94 on the momentum indicator.
So we’ll use the following system:
Short trades
- Enter if momentum (50-period setting) above 106 on the daily chart and
- There’s a touch of the top band of the Keltner Channel (20-period setting, 3.5 average true range multiple)
Long trades
- Enter if momentum below 94 on the daily chart (to keep it symmetrical around the 100 level) and
- There’s a touch of the bottom band of the Keltner Channel
Exit trades if either:
- Momentum runs back between 94-106
- Touch of the 100-period SMA
Let’s see how it worked out.
Example #1
Here’s this system applied to a daily chart of the S&P 500.
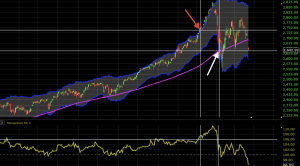
The horizontal line in the bottom chart represents the momentum level we’re looking for.
On the very left side of the chart, there was an upward breach of 106 on the momentum indicator but no concomitant upward touch of the Keltner Channel.
But we finally see both occur later on, marked by the first vertical white line that extends across both charts.
The second vertical line corresponds to the trade’s exit, where there is both a touch of the Keltner Channel and 100-period SMA at the same time. The horizontal lines show the price levels of the trade and show a decent profit for the short trade taken as part of the rules associated with this system.
Example #2
Here we’re using the same strategy on the AUD/USD currency pair. We need a break of momentum above 106 (or below 94), a touch of the top band of the Keltner Channel (or touch of the bottom band), and either a drop of momentum back into the 94-106 range or touch of the 100-period SMA.
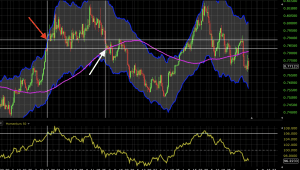
Again, the horizontal line on the momentum indicator (bottom chart) represents the 106 level. The first vertical line on both charts represents the instance where our criteria was satisfied (resulting in a short trade). The second vertical line denotes trade exit due to a touch of the 100-period SMA. The horizontal line on the top chart show the entry and exit prices. This trade made a slight profit.
No other trades would have been taken on the price history displayed on this chart.
Breakout Strategy
For a breakout strategy, we trade in the direction of high momentum levels, rather than taking a stretched momentum indicator reading as a price reversal signal.
For this we need to set up a new set of indicators. To keep things simple, we can use moving averages. For them to have value they need to be shorter in length. Trading with momentum is inherently a strategy that uses a short-term timeframe.
High rates of change in price in one direction or another don’t last very long. Therefore it’s imperative to get in while you can. Moving average that are 30+ periods in length aren’t likely to be very helpful as they have too much old data calculated into them. This is true even if they’re shifted from the simple moving average (SMA) variety to exponential (EMA) or front-weighted.
We can set up a system involving both 5-period and 21-period simple moving averages. The periods, as they relate to the daily chart, would encapsulate data from the past one week and one month, respectively. Both of them react relatively quickly to price, though the 5-period would be characterized as our “fast” moving average and the 21-period our “slow” moving average.
Accordingly, if we’re in a period of strong momentum, the 5-period SMA will be above the 21-period SMA. And thus our system for long trades will be based around the idea that the momentum indicator must be breached above a certain predetermined level with the fast SMA above the slow SMA. The reverse would be true for short trades, where momentum must get below a certain level with the fast SMA below the slow SMA.
So to list it out in terms of steps:
Long Trades
- Momentum above 106
- 5-period SMA above 21-period SMA
Short Trades
- Momentum below 94
- 5-period SMA below 21-period SMA
Exit Trades
When either of these is invalidated.
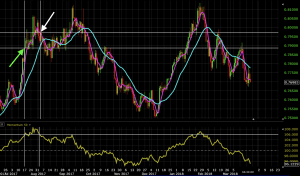
Let’s see how thing may have turned out. I’m using the same markets in each example – both the S&P 500 and AUD/USD currency pair. This illustrates how different traders may view markets differently (which is of course good as differing opinions and approaches are what make a market in the first place).
Example #1
Our trade criteria are met on the long side as momentum moves above the 106 level and the 5-period SMA moves above the 21-period SMA. This captured a large part of the up move as this particular market went exponential. Momentum fell below 106 and the SMA crossed right around the same time, giving us indication to exit the trade.
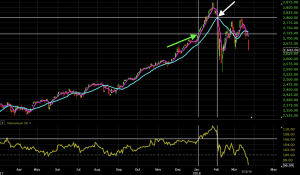
The horizontal white line on the bottom chart show the 106 momentum level. The vertical lines show the time interval for which the trade was open. The horizontal white lines on the top chart show the price levels of the entry and exit. The green arrow denotes the entry level while the white arrow identifies the trade’s exit.
This trade made a profit of about 3%.
Example #2
Here’s the same breakout rules-based system applied to the AUD/USD. In this case, we have two trades.
Trade #1
We see a rise in the momentum indicator above 106. The fast SMA is already above the slow SMA, so this facilitates a long trade.
Once again, the horizontal line on the bottom chart denotes the 106 momentum level. The vertical lines on both charts show trade entry and exit. The horizontal lines on the price chart show the price level of the entry (green arrow) and price level of the exit (white arrow). This made a profit of a little over 1%.
Trade #2
Here we have another case where momentum broke 106, and the fast SMA was above the slow SMA. This allows for a long trade (green arrow). Once momentum retreated back below this level, the trade would be exited (white arrow).
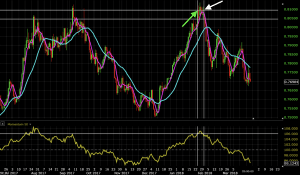
This trade was not profitable, but lost only 0.5%. One of the nice things about this system is that if the trade doesn’t work out it will usually be closed out quickly. With a relatively high momentum threshold (the 106 level) and with the SMAs at just 5 and 21 periods, any slowdown in momentum will be caught quickly.
Conclusion
Momentum refers to the change in a security’s price over a specified period of time. It is effectively an oscillator, as prices never go exponential indefinitely. Shorter period settings on the momentum indicator will give choppier action. Longer period settings, on the other hand, will give smoother action that better resembles meaningful price trends.
The momentum indicator can be interpreted as best used for price reversal – i.e., market getting unsustainably extended in one direction. Or it can be a breakout signaling indicator where one can trade in the direction of the trend.
For those who are more comfortable trading reversals or believe in mean reversion from a momentum standpoint, the indicator would best be used for price reversals. Reversals are also relevant for the “buy low, sell high” crowd.
For those who believe that momentum is a way to make profits quickly, this indicator can be highly useful in that respect as well. Taking trades once momentum gets above a certain threshold can be a way to profit while the market is still trending heavily (and perhaps emotionally) in one direction or another.
Ideally, the momentum indicator should be paired with others to help improve the statistical accuracy of the signals it provides.