300+ Finance Quant Interview Questions (And Answers)


Preparing for a quant finance interview involves tackling a range of questions that test your knowledge in mathematics, finance, and programming, along with your problem-solving skills.
Behavioral and situational questions will also be part of the interview.
Here are some key areas you should be prepared to address, along with example questions and answers for each:
I. Mathematics and Statistics Interview Questions
Probability Theory: Explain Bayes’ Theorem and its applications in finance.
Bayes’ Theorem is used in finance to update the probability of a hypothesis as more evidence becomes available.
An application would be updating the valuation of a public company after quarterly earnings results.
Linear Algebra: How do eigenvalues and eigenvectors apply to risk management?
Eigenvalues and eigenvectors are used in identifying the principal components in risk assessment models.
Calculus: Describe how you would use stochastic calculus in option pricing.
Stochastic calculus is used to model the random behavior of asset prices in the Black-Scholes model and other option pricing frameworks.
Statistics: Explain the Central Limit Theorem and its significance in modeling.
The Central Limit Theorem underpins the assumption that sample averages of financial data will tend to follow a normal distribution.
This is important for many statistical models in finance.
However, much financial data is fat-tailed and doesn’t follow a standard normal distribution.
Numerical Methods: Discuss the application of finite difference methods in quantitative finance.
Finite difference methods are used for numerically solving differential equations in financial models, such as option pricing.
Stochastic Processes: Describe the differences between a Wiener process (Brownian Motion) and a Poisson process.
Wiener processes (Brownian motion) model continuous paths with Gaussian increments.
Poisson processes model discrete events, such as jumps in asset prices.
Time Series Analysis: How would you use ARIMA models in predicting financial markets?
ARIMA models are used for forecasting future trends by analyzing past time series data in financial markets.
However, past data isn’t necessarily indicative of future data.
Partial Differential Equations (PDEs): Explain the Black-Scholes PDE and its significance.
The Black-Scholes PDE is fundamental in option pricing, providing a theoretical estimate of the price of European-style options.
Optimization Theory: Discuss convex optimization in the context of portfolio allocation.
Convex Optimization is used to optimize portfolios by minimizing risk for a given level of expected return.
Graph Theory: How can graph theory be applied in network analysis of financial markets?
Graph Theory is applied to analyze and visualize the relationships and networks in financial markets.
Advanced Probability and Statistics
Multivariate Distributions: Discuss the importance of copulas in modeling joint distributions in finance.
Copulas are used to model and understand the dependencies between different financial variables or instruments.
Markov Chains: What are they? And describe the application of Markov Chains in credit risk modeling.
Markov Chains are statistical models that describe a system undergoing transitions from one state to another – with the probability of each state change depending solely on the current state and not on the sequence of events that preceded it.
Markov chains are used to model credit rating transitions and default probabilities.
Non-Parametric Methods: When would you use non-parametric methods over parametric methods in finance?
Non-Parametric Methods are used when data doesn’t fit standard parametric models (e.g., normal distribution).
They offer flexibility in financial data analysis.
The downside is they require a lot of data and can be computationally intensive.
Statistical Hypothesis Testing: Discuss the role of hypothesis testing in algorithmic trading.
Hypothesis Testing is used to validate trading strategies and models before implementation.
Advanced Time Series Analysis
State-Space Models and Kalman Filters: Describe their application in filtering market data.
State-Space Models and Kalman Filters are used for estimating hidden financial states in a time series – e.g., asset prices or market states.
Extreme Value Theory: Explain how this theory is used in risk management.
Extreme Value Theory is used to assess and manage the risk of extreme market movements.
Fractional Differencing: Explain its importance in maintaining memory in time series.
Fractional Differencing is important for maintaining memory properties in integrated time series while making them stationary.
High-Frequency Data Analysis: Discuss challenges and techniques in modeling with tick-level data.
High-Frequency Data Analysis challenges include data handling, noise, and microstructure effects, requiring sophisticated models and computational techniques.
Long Memory Processes: How are they relevant in financial time series modeling?
Long Memory Processes are relevant in modeling financial time series exhibiting persistence, like volatility.
Wavelet Analysis: Discuss the use of wavelets in analyzing financial time series.
Wavelet Analysis is used for decomposing financial time series into different frequency components for analysis.
Stochastic Calculus and Continuous-Time Models
Ito’s Lemma: Explain its significance in option pricing.
Ito’s Lemma is a concept in stochastic calculus, used for the dynamic modeling of option prices.
Jump-Diffusion Models: How do these models improve upon traditional Black-Scholes?
Jump-Diffusion Models improve on Black-Scholes by incorporating jumps in asset prices. This better captures market realities.
Lévy Processes: Discuss their application in financial modeling.
Lévy Processes are used for modeling more complex stochastic processes with jumps.
Stochastic Volatility Models: Explain models like Heston and how they differ from constant volatility models.
Stochastic Volatility Models, like Heston, account for changing volatility, unlike constant volatility models.
Heath-Jarrow-Morton Framework: Discuss its application in interest rate modeling.
Heath-Jarrow-Morton is a framework for modeling forward rates and yield curves in interest rate markets.
Numerical Methods and Simulation
Monte Carlo Simulation Techniques: Discuss variance reduction techniques in Monte Carlo simulations.
Techniques like antithetic variates and control variates are used to reduce the error and computational time in simulations.
Finite Element Methods in Finance: Explain their application in option pricing.
Finite Element Methods are applied in option pricing for solving PDEs – especially when the payoff or boundary conditions are complex.
PDE Solvers: Discuss numerical methods for solving partial differential equations in finance.
PDE Solvers are used for numerically solving differential equations in complex financial models like exotic options pricing.
Random Number Generation: Explain the importance of good random number generators in simulations.
Random Number Generation is used for the synthetic data and reliability of simulations in financial modeling.
Bootstrap Methods: How are they used in estimating the accuracy of statistical estimates?
Bootstrap Methods are used for statistical estimation and inference – particularly in situations with small sample sizes or unknown distributions.
Optimization and Linear Algebra
Convex and Non-Convex Optimization: Discuss their applications in portfolio optimization.
Convex and Non-Convex Optimization are used for various financial applications including portfolio optimization and asset allocation.
Eigenportfolio Construction: How is this concept used in quantitative finance?
Eigenportfolio Construction leverages eigenvalues and eigenvectors in constructing portfolios that capture the main movements in the market.
Singular Value Decomposition: Explain its use in factor models and risk management.
Singular Value Decomposition is a mathematical technique that decomposes a matrix into three other matrices.
It represents its geometric and algebraic features to simplify operations like dimension reduction, noise reduction, and data compression.
SVD is used in risk management and portfolio optimization to identify and mitigate sources of risk.
Statistical Machine Learning
Supervised vs Unsupervised Learning: Discuss their applications in financial modeling.
Supervised vs Unsupervised Learning – These techniques are used for predictive modeling (supervised) and finding patterns in financial data (unsupervised).
Linear and Nonlinear Programming: Discuss their roles in financial modeling.
Linear and Nonlinear Programming is used for solving various optimization problems in financial modeling.
Linear programming is an optimization technique for finding the best outcome in a mathematical model whose requirements are represented by linear relationships.
Nonlinear programming involves optimization where some of the constraints or the objective function are nonlinear.
Quadratic Programming in Portfolio Management: Explain its application in optimizing portfolio variance.
Quadratic Programming is used for optimizing portfolio variance, a key aspect of modern portfolio theory.
In general, quadratic programming is an optimization method where the objective function is quadratic (relating to squares or terms raised to the power of two) and the constraints are linear – used to find a point that minimizes a quadratic function subject to linear constraints.
Regularization Techniques: Explain LASSO and Ridge regression in the context of finance.
LASSO and Ridge regression are used to prevent overfitting in financial models.
Decision Trees and Random Forests: Discuss their use in credit scoring models.
Decision Trees and Random Forests are applied in credit scoring and other classification problems in finance.
Related: 15+ Non-Parametric Models in Finance
Support Vector Machines: Explain their application in market classification problems.
Support Vector Machines are used in market classification and prediction problems, such as identifying trends in asset prices.
Neural Networks and Deep Learning: Discuss the challenges and opportunities of using these methods in financial prediction.
While Neural Networks and Deep Learning offer strong modeling capabilities, they have challenges in interpretability and data requirements.
Neural networks are computational models inspired by the human brain, consisting of interconnected nodes or neurons, which process information in layers to perform tasks like classification and prediction.
Deep learning is a subset of machine learning involving neural networks with multiple layers that extract progressively higher-level features from raw input.
Mathematical Finance
Martingales and Measure Theory: Explain their significance in financial mathematics.
Martingales and Measure Theory are fundamental concepts in financial mathematics. They’re popular in models associated with fair pricing and hedging.
Martingales in probability theory are sequences of random variables where the future value is expected to be equal to the current value, given all past information.
Measure theory is a mathematical framework for systematically handling sizes and quantities, fundamental to probability and integration.
Arbitrage Theory: Discuss the concept of no-arbitrage in pricing financial derivatives.
No-Arbitrage Principle is the cornerstone of derivative pricing.
It ensures that prices of financial instruments preclude arbitrage opportunities.
Optimal Stopping Theory: Explain its application in American option pricing.
Optimal Stopping Theory is applied in pricing American options, where the holder has the right to exercise at any point before expiration.
Utility Theory and Risk Aversion: Discuss their importance in portfolio choice.
Utility Theory and Risk Aversion are central to portfolio choice and asset pricing – addressing how traders/investors balance risk and return.
Dynamic Hedging: Explain the concept and its practical challenges.
Dynamic Hedging involves continuously adjusting the hedge of a derivative to counteract price changes.
But it faces practical challenges like transaction costs.
II. Programming and Algorithmic Questions
Data Structures: How would you implement a Monte Carlo simulation in C++?
For Monte Carlo Simulation in C++, use random number generation for stochastic variables and iterative loops to simulate and aggregate results.
Algorithm Design: Write a function to calculate the Fibonacci sequence in Python.
Create a function using either iteration or recursion to return the nth Fibonacci number.
Machine Learning: Discuss the use of regression analysis in predicting stock prices.
Regression Analysis is applied to identify and quantify the relationships between stock prices and various independent variables.
Optimization Techniques: Explain how gradient descent is used in portfolio optimization.
Gradient Descent is used to find the optimal asset weights by minimizing a cost function representing risk or maximizing return.
System Design: Describe how you would design a high-frequency trading system.
Focus on ultra-low latency, high throughput, and reliable data processing capabilities.
C++ is popular for tasks where low latency is important relative to slower languages like Python.
High-Performance Computing: Discuss the importance of parallel computing in quantitative analysis.
Essential for handling complex, computationally intensive tasks and large datasets rapidly.
Big Data Analytics: How do you handle and analyze large financial datasets?
Employ distributed computing frameworks and efficient data processing algorithms for analysis and storage.
Natural Language Processing (NLP): Explain the application of NLP in sentiment analysis for trading.
NLP in Sentiment Analysis is used to analyze and quantify sentiment from textual data sources.
Deep Learning: Discuss the use of neural networks in forecasting financial time series.
Neural Networks are applied to capture complex patterns and dependencies in historical data to predict future trends.
Algorithmic Complexity: How do you optimize algorithms for speed and efficiency?
Optimizing algorithm speed and efficiency is achieved by reducing computational complexity, using efficient data structures, and parallel processing.
Programming Fundamentals
Data Structures: Describe the use of hash tables in financial data processing.
Hash Tables are used for efficient, fast access and retrieval of financial data based on key-value pairs.
Object-Oriented Programming (OOP): How does OOP enhance the development of financial models?
OOP enhances modularity, reusability, and maintainability of complex financial modeling software.
Memory Management: Discuss the importance of memory management in high-frequency trading systems.
Memory Management is important for optimizing the performance and speed of trading systems.
Concurrency and Multithreading: Explain how these concepts are utilized in real-time trading systems.
Concurrency and multithreading in trading systems enable simultaneous data processing and order execution in real-time trading environments.
(This is why programming languages like Scala are often prized.)
Database Management: Discuss the use of SQL and NoSQL databases in financial data storage.
SQL is used for structured data querying.
NoSQL caters to unstructured data (better scalability and flexibility).
When would you use linked lists?
Linked lists are used in scenarios where efficient insertion and deletion of elements are important, without the need for contiguous memory allocation.
In quantitative finance, linked lists are beneficial for managing time-series data, such as stock prices or trade orders, where the dataset’s size may change dynamically.
They allow for flexible adjustment to the data structure size, facilitating operations like adding or removing financial transactions without the overhead of resizing an array.
How does a hashmap work?
A hashmap, also known as a hash table, operates on the principle of key-value storage, providing fast data retrieval by using a hash function to compute an index into an array of slots, from which the desired value can be found.
In finance, hashmaps are used for managing and accessing large datasets, such as historical price information or mapping securities’ identifiers to their attributes, owing to their capability for near-constant time complexity for lookup, insert, and delete operations under most conditions.
Difference between Python and C++
Python is a high-level, interpreted, dynamically-typed programming language known for its ease of use and readability, which has made it widely adopted for data analysis, machine learning, and prototyping in finance.
C++, on the other hand, is a lower-level, compiled, statically-typed language, offering fine-grained control over system resources and performance optimization.
C++ is preferred in quantitative finance for developing high-frequency trading algorithms and real-time financial simulation models, where execution speed and memory management are the #1 priority.
Algorithms and Computational Complexity
Search Algorithms: Describe a scenario where a binary search is used in financial applications.
Binary Search is ideal for quickly locating financial instruments or prices in a sorted dataset.
Sorting Algorithms: Explain the importance of efficient sorting in large-scale financial data analysis.
Important for organizing and analyzing large datasets efficiently in financial contexts.
Graph Algorithms: Discuss the application of shortest path algorithms in financial networks.
Shortest Path Algorithms are used for optimizing transaction paths and analyzing connectivity in financial systems.
Dynamic Programming: Explain its use in option pricing models.
Dynamic Programming is used to efficiently price options with multiple sources of uncertainty or path dependency (e.g., Asian options).
Big O Notation: Discuss the significance of algorithmic complexity in financial computing.
Essential in ensuring scalability and efficiency of algorithms in financial data processing and analysis.
Difference between array and list.
In the context of programming, particularly in languages like Python:
- Array – An array is a data structure that stores a collection of items at contiguous memory locations.
- The items are of the same data type.
- Arrays support random access, meaning you can directly access any element using its index.
- In Python, arrays are provided by the array module and are more efficient for storing large amounts of data that is all of the same type.
- List – A list is a more flexible data structure provided by Python that can hold elements of different data types.
- Lists are also ordered, meaning the elements have a defined order that will not change unless the list itself is modified.
- Lists support operations like appending, insertion, deletion, and concatenation, which makes them more versatile than arrays for many tasks.
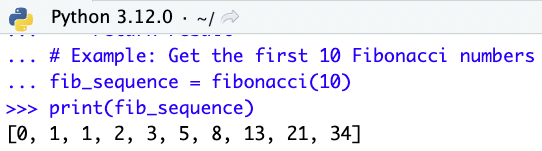
Write a method to solve the Fibonacci sequence (on paper)
def fibonacci(n):
    if n <= 0:
        return []
    elif n == 1:
        return [0]
    elif n == 2:
        return [0, 1]
    else:
        fib_seq = [0, 1]
        for i in range(2, n):
            next_element = fib_seq[i-1] + fib_seq[i-2]
            fib_seq.append(next_element)
        return fib_seq

# Example: Get the first 10 Fibonacci numbers
fib_sequence = fibonacci(10)
print(fib_sequence)
This method generates the first n elements of the Fibonacci sequence, starting with 0 and 1.
What is a generator and an iterable? Can generators be reused?
- Generator: A generator in Python is a special type of iterator that is used to generate a sequence of values lazily.
- That means it generates the next value only when it is needed, which makes it more memory-efficient for large datasets.
- Generators are created using either generator functions (using yield statements) or generator expressions.
- Iterable: An iterable is any Python object that can be looped over (iterated through) using a loop, like a for loop.
- This includes lists, tuples, dictionaries, sets, and strings. An iterable implements the __iter__() method, which returns an iterator.
Generators can’t be reused once they have been iterated through to completion.
To reuse the sequence generated by a generator, you need to create a new generator instance.
Explain Deadlock
Deadlock refers to a specific condition when two or more processes are each waiting for another to release a resource, or more than two processes are waiting for resources in a circular chain.
In this situation, none of the processes can proceed, and deadlock occurs.
For instance, if Process A holds Resource 1 and waits for Resource 2, which is held by Process B, which in turn waits for Resource 1 held by Process A, neither process can proceed.
This situation is a classic example of deadlock. Deadlocks are important to avoid in concurrent programming because they can halt the progress of a software application.
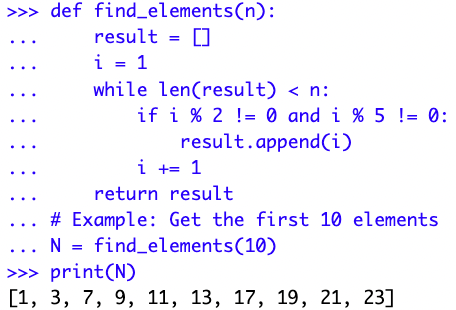
Return the first N elements which aren’t multiples of 2 or 5
Here is a Python function to return the first N elements that are not multiples of 2 or 5:
def find_elements(n):
    result = []
    i = 1
    while len(result) < n:
        if i % 2 != 0 and i % 5 != 0:
            result.append(i)
        i += 1
    return result


# Example: Get the first 10 elements

N = find_elements(10)

print(N)
Quantitative and Statistical Programming
Time Series Analysis in Python/R: How to write a script to model and forecast financial time series data.
Implement statistical or machine learning models in Python or R to predict future financial market trends.
You may be asked to perform a test for any programming language on your resume.
Linear Regression in Java: Discuss the implementation of linear regression for predicting stock prices.
Implement regression models in Java to predict stock prices based on historical data and financial indicators.
Optimization Problems in Scala: Explain how to solve a portfolio optimization problem using Scala.
Use optimization algorithms to balance risk and return, tailored to investor preferences.
Machine Learning Algorithms in Python: Describe the implementation of a decision tree algorithm for credit scoring.
Decision tree algorithms are implemented to classify and predict creditworthiness based on financial histories and behaviors.
Software Engineering Best Practices
Version Control Systems: Discuss the importance of Git in collaborative financial software development.
Git is essential for version control, collaborative development, and code management.
Unit Testing and TDD: Explain the role of unit testing in ensuring the reliability of financial models.
Unit testing and TDD are used for verifying the accuracy and reliability of financial algorithms and models.
Code Optimization: Discuss strategies for optimizing performance in quantitative code.
Focus on efficient algorithms, memory management, and profiling to enhance performance.
Design Patterns: Explain the use of design patterns in financial software architecture.
Facilitate the development of flexible, scalable, and maintainable financial software systems.
System Design: Describe how to architect a scalable and robust financial data processing system.
Design for high scalability, reliability, and performance.
Practical Programming Challenges
API Integration: Discuss the process of integrating with a financial market data API.
API integration involves securely connecting and synchronizing with financial data sources for real-time data and trading capabilities.
Real-Time Data Processing: Explain how to handle and process real-time market data streams.
Implement systems to manage and analyze financial data streams instantaneously for timely decision-making.
Error Handling and Exception Management: Explain best practices in a high-stakes financial computing environment.
Implement robust practices to manage exceptions and ensure system stability and data integrity.
Parallel Computing and GPU Usage: Discuss the use of GPUs in accelerating financial computations.
Leverage for parallel processing capabilities to enhance the speed of complex quantitative analyses.
Advanced Programming Topics
Quantum Computing: Discuss the potential impact of quantum computing on financial modeling.
Potential to improve computational speed and efficiency in solving complex financial problems.
Blockchain and Cryptocurrencies: Explain the implications of blockchain technology in finance.
Offers transparency, security, and efficiency as well as adding value to payments, settlements, and digital asset management.
Cloud Computing in Finance: Discuss the advantages and challenges of cloud computing for quantitative finance.
Provides scalable computational resources but requires careful consideration of security and compliance.
Artificial Intelligence in Algorithmic Trading: Explain how AI is transforming trading strategies.
Uses advanced algorithms for data-driven decision-making and better trading strategies.
Cybersecurity in Financial Systems: Discuss the importance of cybersecurity in protecting financial data and algorithms.
For safeguarding sensitive financial data and maintaining trust in digital financial transactions.
III. Financial Knowledge Interview Questions
Option Pricing Models: Compare and contrast the Black-Scholes model and the Binomial model.
Black-Scholes Model assumes a continuous time frame and lognormal distribution of stock prices.
The Binomial Model uses discrete time steps and variable asset prices at each step.
Risk Management: How do you measure and manage Value at Risk (VaR)?
VaR is measured as the maximum potential loss over a given time period at a certain confidence level, and managed through diversification, hedging, and setting risk limits.
Fixed Income Securities: Explain the concept of duration and convexity in bond pricing.
Duration measures the bond’s price sensitivity to interest rate changes.
Convexity accounts for the rate at which duration changes as interest rates change.
Portfolio Theory: Describe the Capital Asset Pricing Model (CAPM).
CAPM describes the relationship between systematic risk and expected return for assets.
Typically used in the pricing of risky securities.
Derivatives: Discuss the importance of Greeks in options trading.
Greeks quantify the sensitivity of option prices to factors such as price, time, and volatility, guiding risk management and trading strategies.
Related: Malliavin Calculus (branch of stochastic calculus)
Exotic Options: Explain the pricing of a barrier option compared to a vanilla option.
Barrier options have a price that depends on whether the underlying asset reaches a certain price level.
Vanilla options have a fixed strike price and expiry.
Interest Rate Models: Discuss the Hull-White model in interest rate modeling.
Credit Derivatives: How do you model the risk of a credit default swap?
Involves assessing the probability of default, potential recovery rate, and market conditions to estimate the risk and pricing.
Swaps: How is the swap rate calculated?
The swap rate in an interest rate swap is determined by equating the present value of the fixed leg payments to the present value of the expected floating leg payments of the swap, under the assumption of no arbitrage.
The calculation involves discounting future cash flows of both legs by appropriate discount factors, which are derived from the current yield curve.
In practical terms, the swap rate reflects:
- the market’s expectation of future interest rates
- credit risk, and
- the supply and demand dynamics for swaps with similar maturities
Asset-Backed Securities: Describe the process of securitization and its risks.
Involves pooling various types of debt and selling them to investors. Introduces risks like credit risk and liquidity risk.
Explain the differences between historical simulation and Monte Carlo simulation for VaR calculation.
Historical simulation uses actual past returns for VaR calculation.
Monte Carlo simulation uses random variables and assumptions about market behavior.
Financial Markets and Instruments
Market Structure: Describe the difference between exchange trading and over-the-counter markets.
Exchange trading is done through formal exchanges with standardized contracts.
Over-the-counter markets are decentralized and involve more customized agreements.
Equity Instruments: Explain the valuation of preferred shares versus common stock.
Preferred shares have fixed dividends and priority in assets during liquidation.
Common stock has variable dividends and voting rights.
As we noted in a different article, common stock can be thought of nominal bonds with uncertain coupons.
Bond Pricing: How do you price a zero-coupon bond?
Calculated by discounting the bond’s face value by the yield to maturity. Reflects the present value of its future payoff.
Foreign Exchange Markets: Discuss the carry trade strategy in currency markets.
Involves borrowing in a low-interest currency and investing in a high-interest currency to profit from the interest rate differential.
Commodities and Futures: Explain the concept of contango and backwardation in futures markets.
Contango is when future prices are higher than spot prices.
Backwardation is when future prices are lower than spot prices.
What is a butterfly trade?
A butterfly trade in finance, particularly in fixed income and derivatives markets, is a neutral strategy that involves positioning in three different securities or contracts with varying maturities or strike prices.
In the context of bond markets, a butterfly trade typically consists of going long (buying) securities with short and long maturities and short (selling) securities with a medium maturity.
The aim is to profit from changes in the curvature of the yield curve. For options, a butterfly spread involves buying or selling two options at a lower and higher strike price, and selling or buying two options at a middle strike price.
This strategy bets on low volatility, aiming to profit when the underlying asset price stays close to the middle strike price.
How to calculate 5y5y swap rate based on 5y swap and 10y swap?
The 5y5y forward swap rate refers to the implied 5-year swap rate that starts 5 years from now.
To calculate this rate from the 5-year swap rate and the 10-year swap rate, one can use the principle of no-arbitrage in forward rate agreements.
The calculation involves finding the rate that equalizes the combined present value of the two swaps (5-year and the forward-starting 5-year) with the present value of a single 10-year swap.
Mathematically, this can be expressed through the relationship of compounding the 5-year swap rate and the 5y5y forward swap rate to match the 10-year swap rate.
This involves solving for the forward rate in the equation that relates these rates, taking into account the compounding effect over the respective periods.
Example
To illustrate how to calculate the 5y5y forward swap rate from a 5-year swap rate and a 10-year swap rate, let’s use an example with hypothetical swap rates. Assume:
- The current 5-year swap rate is 2% per annum.
- The current 10-year swap rate is 3% per annum.
We want to find the 5y5y forward swap rate, which is the implied rate for a swap starting in 5 years and lasting for another 5 years.
First, we need to understand that the 10-year swap rate can be thought of as a weighted average of the 5-year swap rate and the 5y5y forward swap rate we are trying to find, adjusted for the time value of money.
The formula to equate the present values (PV) of the cash flows (ignoring the notional for simplicity as it cancels out) is:
(1 + S_5)^5 * (1 + F_5y5y)^5 = (1 + S_10)^10
Where:
- S_5 = 5-year swap rate
- F_5y5y = the 5y5y forward swap rate we want to calculate
- S_10 = is the 10-year swap rate
Plugging in the numbers:
- (1 + .02)^5 * (1 + F_5y5y)^5 = (1 + .03)^10
- (1 + F_5y5y)^5 = 1.34392/1.10408 = 1.21739
Taking the 5th root of both sides:
1 + F_5y5y = (1.21739)^(1/5) = 1.0403
F_5y5y = 1.0403 – 1 = 0.0403 or 4.03%
Thus, the 5y5y forward swap rate, based on the given 5-year and 10-year swap rates, would be approximately 4.03% per annum.
What is a swaption?
A swaption is an option granting its holder the right but not the obligation to enter into an interest rate swap agreement as the fixed-rate payer or receiver on a specified date in the future, at a predetermined fixed rate (the strike rate).
Swaptions are used for hedging against interest rate movements or for speculative purposes.
There are two primary types of swaptions:
- payer swaptions, which give the holder the right to enter into a swap where they pay the fixed rate and receive the floating rate; and
- receiver swaptions, which allow the holder to receive the fixed rate and pay the floating rate
The valuation of swaptions involves complex models that account for the volatility of interest rates and the time value of the option.
What is a cap and floor?
In interest rate markets, a cap is a derivative contract that provides the purchaser with protection against rising interest rates.
It consists of a series of European call options (caplets) on a specified reference rate, typically LIBOR, with a set strike rate.
If the reference rate exceeds the strike rate, the seller pays the buyer the difference, effectively capping the interest rate for the buyer.
Conversely, a floor is a derivative that protects against falling interest rates, comprising a series of European put options (floorlets) on the reference rate.
If the reference rate falls below the strike rate, the seller compensates the buyer for the difference, setting a minimum interest rate floor.
Caps and floors are used for hedging against interest rate fluctuations and are priced based on models that consider the volatility of the reference rate, the level of interest rates, the strike rate, and the maturity of the contract.
Derivatives and Options Theory
Swaps: Explain the valuation of interest rate swaps.
Involves exchanging one stream of future interest payments for another, based on a specified principal amount.
Asian Options: How do Asian options differ from European options in terms of pricing?
Asian options’ payoff depends on the average price of the underlying asset over a period.
European options depend on the price at expiration.
American options are like European options but have the early exercise feature (which also makes them more valuable relative to European options).
Barrier Options: Discuss the factors that affect the pricing of knock-in and knock-out options.
Influenced by the underlying asset’s price, barrier level, volatility, and time to expiration, among other factors.
Swaptions: Explain what a swaption is and how it is used in finance.
A financial derivative granting the holder the right, but not the obligation, to enter into an interest rate swap agreement.
Credit Derivatives: Discuss how credit default swaps are priced and used.
Involves assessing the probability of default and expected loss, considering the credit quality of the underlying asset.
Market Making
In an interview, you might play market-making games with the interviewer.
Question
Imagine you are a market maker with access to a list of actual prices traded on the exchange.
Based on your market understanding and inventory position, how would you determine your theoretical price for a security?
How would you then set your bid-ask spread around this price, and how would you adjust your quotes in response to changes in your inventory position or market volatility?
Here’s how a candidate should answer:
Understanding Theoretical Price:
- Explain that the theoretical price is their best estimate of the security’s fair value.
- It’s derived from a combination of quantitative models, historical data, and real-time market information.
- Emphasize the importance of incorporating factors like interest rates, dividends, and liquidity in the calculation.
Setting the Bid-Ask Spread:
- Discuss the need to balance profitability and trade execution probability when setting the spread.
- Mention that a tighter spread attracts more trades but reduces profit margin per trade, while a wider spread does the opposite.
- Illustrate understanding that market volatility, liquidity, and confidence in the theoretical price assessment influence the spread width.
- Higher volatility or lower confidence leads to a wider spread to reduce risk.
Inventory Risk Management:
- Detail how you would adjust bid and ask prices based on their current inventory levels.
- If you’re overstocked, you would lower the ask price to encourage selling, and conversely, raise the bid price to buy back stock if understocked.
- Explain the concept of book skew, adjusting prices to manage inventory risk, and stress the importance of not becoming too exposed to market movements in one direction (as you’re market making, not tactically trading).
Market Sensitivity and Adaptability:
- Demonstrate an understanding of the need to monitor markets and adjust pricing strategies accordingly.
- Talk about using automated trading algorithms to dynamically adjust their quotes in real-time based on pre-defined criteria.
Risk Management:
- The answer includes a discussion on the importance of risk management practices, such as setting maximum inventory levels and using stop-loss orders to protect against market gapping or unexpected liquidity events.
Firms also may play market making games with an interviewee.
Here’s how this type of process works:
Example Dialogue for Market Making Interview Game
Interviewer: Let’s start with the market making game. You’re the market maker for XYZ Corp, and the current mid-market price is $100. How would you set your initial bid and ask?
- Interviewee: Given the current price of $100, I would set my bid at $99.50 and my ask at $100.50. This 1% spread accounts for the current market volatility and liquidity, ensuring I can manage risk while facilitating trade.
Interviewer: Great, now an earnings announcement just came out, and XYZ Corp reported higher than expected profits. How do you adjust your market?
- Interviewee: With positive news, I expect the stock price to rise. I would adjust my bid to $100.25 and my ask to $101.25, narrowing the spread slightly to reflect increased confidence in the stock’s value while anticipating higher demand.
Interviewer: The market has reacted, and you’ve accumulated an excess inventory of XYZ shares. How would you handle this?
- Interviewee: With excess inventory, I need to encourage sales without significantly impacting the price. I would adjust my ask down to $101 to make it more attractive for buyers, while monitoring the market closely to avoid selling too low.
Interviewer: Suddenly, there’s a rumor of a regulatory issue for XYZ Corp, causing market panic. How do you respond?
- Interviewee: In this high-volatility scenario, I would widen my spread to manage risk, setting my bid at $99 and ask at $102. This allows me to remain in the market but protects against large, sudden movements as the situation develops.
Interviewer: After the trading day, how would you evaluate your performance in this game?
- Interviewee: I would review the trades against market movements and news events to assess how well my bid-ask adjustments managed inventory and captured profit opportunities. I would analyze if I reacted appropriately to news and how my spread decisions affected my risk exposure and profitability.
You might also be asked to “make markets” in things like “what’s the population of Nigeria and set your confidence interval?”
These test your ability to make estimates while also understanding nuance and probability.
In trading, you have to be comfortable with nuance and ambiguity, and any black-and-white thinking can be a red flag in a candidate.
What’s the population of Nigeria and set your confidence interval?
The population of Nigeria is likely between 150 and 300 million, with a 60% confidence interval.
How would you set the population of Nigeria with an 80% confidence interval?
I would say 120 million to 320 million with an 80% confidence interval.
The main thing here is to expand your interval as your percentage confidence goes up.
This illustrates that you understand the basics of confidence intervals and estimations.
Alternative Investment Concepts
Leveraged Buyouts (LBOs): Explain the financial mechanics behind LBOs.
Involves buying a company mainly through debt, with the intention of improving its value and selling it or taking it public.
Hedge Funds: Discuss different hedge fund strategies, like long/short equity.
Hedge funds employ diverse strategies like long/short equity, market-neutral, or arbitrage to achieve returns regardless of market direction.
Private Equity: How is valuation in private equity different from public equity?
Private equity involves more complex valuation due to the lack of publicly available data and liquidity compared to public equity.
Real Estate Investment Trusts (REITs): Explain how REITs are structured and valued.
REITs own and operate income-generating real estate.
Offer investors a way to invest in property assets with liquidity similar to stocks.
Venture Capital: Discuss the valuation methods used in venture capital.
Includes methods like comparable company analysis, discounted cash flow, and the Berkus method, considering the high risk and potential high reward.
Related: VC Valuation, Portfolio Construction, and Risk Management
Risk Management and Portfolio Theory
Diversification and Correlation: Explain the role of correlation in portfolio diversification.
Correlation between assets determines the effectiveness of diversification in reducing portfolio risk.
Modern Portfolio Theory (MPT): Discuss the limitations of MPT in current financial markets.
Modern Portfolio Theory’s limitations include assumptions of normal distribution of returns and constant correlation, which may not hold in real markets.
Black-Litterman Model: Explain how this model improves on traditional portfolio optimization.
The Black-Litterman Model integrates market equilibrium and subjective views to provide a more customized asset allocation.
Tail Risk Hedging: Discuss strategies to hedge against tail risk in portfolios.
Tail Risk Hedging Strategies use financial instruments like options to protect against extreme market movements that could lead to significant losses.
Factor Investing: Explain the concept and its application in portfolio construction.
Investing based on attributes or factors believed to influence investment returns, such as size, value, and momentum.
Financial Theory and Corporate Finance
Modigliani-Miller Theorem: Discuss its implications on capital structure.
Suggests that under certain conditions, a firm’s value is unaffected by its capital structure and financing decisions.
Dividend Discount Model (DDM): Explain how to value a stock with DDM.
Values a stock based on the present value of its future dividend payments.
Capital Structure Decisions: Discuss the trade-off theory versus the pecking order theory.
Trade-off theory balances tax benefits of debt against bankruptcy costs.
Pecking order theory prioritizes internal financing and debt over equity.
Corporate Governance: How does corporate governance affect financial decision-making?
Corporate Governance influences a company’s performance, risk management, and the trust it garners from investors and the market.
Mergers and Acquisitions (M&A): Discuss the financial aspects of evaluating an M&A deal.
Involves assessing the financial synergy, valuation, and potential impacts on earnings and cash flow of the combined entities.
Economic Theory and Macroeconomic Variables
Inflation and Interest Rates: Discuss the Fisher effect.
The Fisher Effect indicates the relationship between inflation and interest rates, where real interest rates are nominally adjusted according to expected inflation.
Business Cycles: How do business cycles affect financial markets?
Business Cycles affect investment returns, risk appetite, and overall market sentiment.
Monetary Policy: Discuss the impact of quantitative easing on financial markets.
Quantitative easing generally lowers interest rates and increases asset prices.
This influences investment and consumption decisions.
Fiscal Policy: Explain how fiscal policy decisions can impact market dynamics.
Fiscal policy decisions, like changes in government spending and taxation, can significantly impact economic growth and market conditions.
International Trade and Capital Flows: Discuss the impact of trade balances on currency values.
Trade imbalances can affect currency values, where surplus tends to strengthen and deficit weakens the domestic currency.
Financial Regulation and Ethics
Basel Accords: Discuss the impact of Basel III on bank risk management.
Basel III enhances bank capital requirements, introduces new regulatory measures on liquidity and leverage.
Aims to improve the banking sector’s ability to absorb shocks.
Sarbanes-Oxley Act: Explain how this act impacts corporate financial reporting.
Strengthens corporate financial reporting requirements, enhancing transparency and investor confidence.
MiFID II: Discuss its impact on European financial markets.
Aims to increase transparency and reduce risks in European financial markets, affecting trading, transaction reporting, and investor protection.
Insider Trading and Market Manipulation: Discuss the quantitative methods used to detect these illegal activities.
Uses statistical and algorithmic methods to identify abnormal trading patterns and price movements indicative of manipulative activities.
IV. Problem Solving and Brainteasers
Logic Puzzles: You have 12 balls, one of which is different in weight (heavier or lighter). Find the odd ball using a scale only three times.
Weigh 4 balls against another 4.
- If equal, the odd ball is in the remaining 4. Weigh 3 of these against 3 known good ones.
- If equal, the remaining ball is the odd one.
- If unequal, weigh 2 of the suspect 3 against each other to find the odd ball.
- If unequal, weigh 3 balls from the heavier group against 3 known good ones.
- If equal, the remaining unweighed ball is the odd one.
- If unequal, weigh 2 of the suspect 3 against each other to find the odd one.
At another party, everybody shakes hands with everybody else. If there are 66 handshakes, how many people are at the party?
In a party where everyone shakes hands with everyone else, the number of handshakes is given by the formula n(n – 1)/2, where n is the number of people.
For 66 handshakes, 66 = n(n – 1)/2.
Solving for n, we get n(n – 1) = 132.
By testing integer values, we find n = 12 because 12 times 11 equals 132.
Therefore, there are 12 people at the party.
You have two string-like fuses. Each burns in exactly one minute. The fuses are inhomogeneous, and may burn slowly at first, then quickly, then slowly, and so on. You have a match, and no watch. How do you measure exactly 45 seconds?
Light one fuse at both ends and the second fuse at one end simultaneously.
When the first fuse has completely burned, 30 seconds have passed, and half of the second fuse remains.
Then, light the other end of the second fuse. It will burn twice as fast and take 15 seconds to finish.
Combining the times, 30 seconds for the first fuse and 15 for the second, you measure exactly 45 seconds.
I tell you that I have two children and that at least one of them is a girl. What is the probability that I have two girls? Assume that boys and girls are equally likely to be born and that the gender of one child is independent of gender of another.
The probability of having two girls is 1/3.
With at least one girl, the possibilities are Girl-Girl, Girl-Boy, and Boy-Girl.
Since we know there’s at least one girl, we eliminate Boy-Boy, leaving three equally likely combinations, only one of which has two girls.
You are a bug sitting in one corner of a cubic room. You wish to walk (no flying) to the extreme opposite corner (the one farthest from you). Describe the shortest path that you can walk. Be sure to mention direction, length, and so on.
The shortest path is to walk diagonally across two sides of the cube.
Imagine unfolding the cube into a flat cross shape and walk straight from one corner to the opposite.
The path’s length is the diagonal of the cube, calculated using the Pythagorean theorem for the cube’s height and width.
Quantitative Puzzles: If you flip a fair coin 100 times, what is the probability of 5 consecutive heads?
To correctly calculate the probability of getting at least one streak of 5 consecutive heads in 100 coin flips, you would typically use a combinatorial approach or a computational simulation.
Nonetheless, this can be quite complex due to the numerous ways such a streak can occur within 100 flips, along with the need to account for overlapping streaks.
A straightforward and more practical method is to use a Monte Carlo simulation.
This approach involves simulating the coin flipping process a large number of times and counting the fraction of simulations where at least one streak of 5 consecutive heads occurs.
In an interview you might be expected to figure this out via a script.
Let’s build one out in Python:
import random


def simulate_coin_flips(n, streak_length, trials):

    streak_count = 0


    for _ in range(trials):

        flips = [random.choice(['H', 'T']) for _ in range(n)]

        if ''.join(['H' for _ in range(streak_length)]) in ''.join(flips):

            streak_count += 1


    return streak_count / trials


# Parameters

num_flips = 100

streak_length = 5

num_trials = 100000


# Do the simulation

probability = simulate_coin_flips(num_flips, streak_length, num_trials)

probability
(The odds of 5 consecutive heads in 100 flips is about 81.2%, estimated from 100,000 trials.)
Minimum time to cross a bridge with a torch.
Consider a scenario where four individuals must cross a bridge at night with only one torch and a maximum of two people crossing at once, with each individual crossing at different speeds.
The minimum time to cross the bridge involves strategically pairing the individuals and shuttling the torch back to minimize the total crossing time.
Without specifying individual speeds and assuming a generic case, the strategy typically involves sending the fastest individuals across with the torch multiple times to minimize the total time.
Mental Math: Calculate the square root of 289 in your head.
The square root of 289 is 17.
(They might ask you to do more difficult ones, like the square root of 3, 5, 7, etc., which will be between other “obvious” squares and test your ability to understand square relationships to estimate to the closest tenth.)
Analytical Thinking: How would you price an exotic option for which there is no established market?
Use a combination of comparable market data, financial theory, and quantitative methods like Monte Carlo simulation or binomial trees to estimate pricing.
Case Studies: How would you approach building a predictive model for a financial market during a period of high volatility?
Incorporate factors contributing to volatility, use robust statistical methods, and frequently update the model with new data.
Logic and Problem-Solving Questions
Two Doors with Two Guards: One door leads to success, the other to failure. One guard always tells the truth, the other always lies. You can ask one question to one guard. What do you ask?
Ask any guard, “If I asked the other guard which door leads to success, what would he say?” and choose the opposite door.
Three Light Bulbs in a Sealed Room: You are outside a room with three switches, inside are three bulbs. You can enter the room only once. How do you determine which switch controls which bulb?
Turn on one switch, wait, turn it off, turn on another, enter the room:
- one bulb is on (second switch)
- one is warm (first switch), and
- one is off and cool (third switch)
Quantitative Brainteasers
The Weighing Scale Puzzle: You have 9 identical-looking balls, one of which is slightly heavier. How do you find the heavier ball in just two uses of a balance scale?
Weigh 3 balls against 3 others.
- If equal, weigh 2 of the remaining 3 against each other to find the heavier one.
- If unequal, weigh 2 balls from the heavier group against each other to find the heavier one.
The Frog in the Well: A frog falls into a 30-foot well. Each day it climbs 3 feet but slides back 2 feet. How many days will it take to escape the well?
The frog climbs out on the 28th day (climbs 3 feet each day and reaches 27 feet by the 27th day, then climbs 3 feet on the 28th day to exit).
The Missing Dollar: Three people check into a hotel room costing $30. Each person pays $10. Later, the clerk realizes the room costs $25 and gives $5 to the bellboy to return. The bellboy keeps $2 and gives $1 back to each person. Now each person paid $9, totaling $27, and the bellboy has $2, totaling $29. Where’s the missing dollar?
There’s no missing dollar; the total payment is $27 ($25 for the room and $2 kept by the bellboy), not $30.
Probability and Statistics Puzzles
The Birthday Problem: In a room of 23 people, what’s the probability that at least two people share the same birthday?
# Number of people
num_people = 23

# Days in a year
days_in_year = 365

# Calculate the probability of no shared birthdays
prob_unique_birthdays = 1
for i in range(num_people):
prob_unique_birthdays *= (days_in_year - i) / days_in_year

# Calculate the probability of at least one shared birthday
prob_shared_birthday = 1 - prob_unique_birthdays
prob_shared_birthday
Answer: About 50.7% (higher than most would intuitively expect due to the exponential/nonlinear nature of multiplying the probabilities)
The Monty Hall Problem: You’re on a game show with three doors. Behind one is a car; behind the others, goats. You pick a door. The host, who knows what’s behind the doors, opens another door, revealing a goat. Should you switch your choice?
You should switch your choice. Switching doors increases the probability of winning to 2/3.
Advanced Mathematical Puzzles
The Infinite Hotel Paradox: A hotel with an infinite number of rooms and all are occupied gets an infinite number of new guests. How does it accommodate them?
Move each guest from room N to room N+1, freeing up room 1 and accommodating an infinite number of new guests.
The Ant on a Rubber Rope: An ant starts to crawl along a 1-meter rubber rope at a rate of 1 cm per second. If the rope is stretched by an additional meter each second, does the ant ever reach the end of the rope?
The ant does reach the end because its relative progress each second exceeds the rope’s expansion.
The Two Envelope Paradox: You are given two envelopes, each containing a sum of money. One envelope contains twice the amount of the other. You pick one envelope but before opening it, you are given the chance to switch. Should you switch?
There’s no benefit to switching as the expected value in both envelopes is the same.
Creative Thinking and Lateral Puzzles
The 4-Liter Jug Challenge: Given a 3-liter and a 5-liter jug, how can you measure exactly 4 liters of water?
Fill the 5-liter jug, pour into the 3-liter jug, leaving 2 liters. Empty the 3-liter jug, transfer the 2 liters into it, then fill the 5-liter jug again and top off the 3-liter jug, leaving exactly 4 liters.
The Farmer, the Fox, the Chicken, and the Corn: How does the farmer cross the river without leaving the fox alone with the chicken or the chicken with the corn?
Take the chicken over first, return alone, take the fox (or corn), bring the chicken back, take the corn (or fox), and finally return to get the chicken.
The Flipping Tiles Game: You have 100 tiles laid out in a row, all face down. On your first pass, you flip every tile. On the second, every second tile. On the third, every third tile, and so on until you only flip the 100th tile. Which tiles are face up at the end?
Tiles numbered with perfect squares (1, 4, 9, 16, …, 100) will be face up.
Analytical and Critical Thinking Challenges
The 8 Queens Puzzle: Place 8 queens on a chessboard so that no two queens threaten each other. How many solutions are there?
The total number of distinct solutions to the Eight Queens Puzzle is 92.
This includes all unique configurations, disregarding symmetrical solutions (i.e., counting mirror images or rotations as the same solution).
If you consider symmetrical configurations as distinct, the number of solutions increases.
Finding these solutions typically involves backtracking algorithms or other methods of systematic search.
Due to the complexity and the sheer number of possible board configurations, it’s impractical to solve this puzzle manually (like chess itself).
It’s a classic example used in computer science to demonstrate algorithmic thinking and recursion.
The 100 Prisoners and a Light Bulb: 100 prisoners are in solitary cells, unable to see, talk, or communicate. There’s a room with a light bulb controlled by a switch outside the room. Each prisoner is brought to the room at random times, with no pattern. They can’t communicate outside the room. How can they devise a plan to ensure they all know when each one has visited the room at least once?
Designate one prisoner as the counter.
Each prisoner who has not yet done so turns on the light when they first visit the room.
The counter turns it off and increments the count. When the count reaches 99, all have visited.
The Shrinking Island: You’re stranded on an island that shrinks by half each day. You can swim, but sharks patrol the perimeter, moving in as the island shrinks. How do you survive?
Wait until the island is small enough to be swum around quickly, then swim in a circle just inside the shark’s patrol path until the island disappears, and swim to safety.
Quantitative Logic Puzzles
The Divisible by 3 Rule: Prove why a number is divisible by 3 if and only if the sum of its digits is divisible by 3.
A number is divisible by 3 if the sum of its digits is divisible by 3 due to how numbers are represented in base 10.
Gold Bars Puzzle: You have seven gold bars, each a different weight. You need to pay an employee daily for seven days, using a bar each day. How do you make the payments with only two cuts of the bars?
Make two cuts: divide one bar into 1/7, 2/7, and 4/7 segments.
Pay with combinations of these pieces each day.
The Poisoned Wine: A king has 1000 bottles of wine, one of which is poisoned. He has 10 rats to test the wine. The poison takes effect exactly 24 hours after consumption. How can the king find the poisoned bottle in just 24 hours?
One rat is needed to test two bottles (feed it two bottles, and it either dies or doesn’t die). Two is needed for 4 bottles, nine is needed for 9 bottles, etc.
So, 10 rats is sufficient to test up to 1,024 bottles.
To identify the poisoned bottle using 10 rats in 24 hours, use a binary digit representation where each bottle is assigned a unique 10-digit binary number (from 0000000001 to 1111101000).
Each rat will drink from bottles corresponding to a specific position being ‘1’ in their binary representation (e.g., the first rat drinks from bottles where the first digit is ‘1’, the second rat where the second digit is ‘1’, and so on).
After 24 hours, the combination of sick rats will directly map to the binary number of the poisoned bottle, pinpointing it uniquely.
V. Behavioral & Situational Questions
These answers will all be personalized, but we’ll give an example for each:
Teamwork: Can you describe a time when you worked as part of a team to solve a difficult problem?
Collaborated closely with a team to develop a new statistical model, overcoming differing opinions through data-driven discussions.
Adaptability: How do you stay updated with the rapidly changing landscape in quantitative finance?
I regularly read industry publications and attend seminars to stay abreast of the latest developments in quantitative finance.
Conflict Resolution: Describe a situation where you had a disagreement with a team member and how you resolved it.
Resolved a disagreement with a colleague by discussing our perspectives and finding a common ground through compromise.
Motivation: What drives your interest in quantitative finance?
The challenge of solving complex financial problems using quantitative methods excites me.
Career Goals: Where do you see yourself in five years within the field of quantitative finance?
In five years, I aim to be leading innovative quantitative projects, possibly in a managerial or a senior analyst role.
Decision Making: Describe a time when you had to make a difficult decision in a project.
Faced with a challenging project decision, I conducted thorough research and risk analysis before making an informed choice.
Innovation: Share an example where you developed a novel solution to a complex problem.
Developed a unique algorithm to optimize portfolio diversification, significantly improving risk-adjusted returns.
Learning from Failure: Can you discuss a project where things didn’t go as planned and what you learned from it?
On a project that underperformed, I learned the importance of rigorous testing and validation of assumptions.
Communication Skills: How do you explain complex quantitative concepts to non-experts?
I break down complex concepts into simpler terms and use analogies to make them relatable to non-experts.
Leadership: Have you ever led a team through a challenging quantitative project?
Led a team on a high-pressure project, maintaining clear communication and focus to meet our objectives.
Teamwork and Collaboration
Describe a time when you had to work closely with a difficult colleague. How did you handle the situation?
Managed a challenging collaboration by focusing on common goals and maintaining professional communication.
Can you share an experience where you had to lead a team through a challenging project?
Successfully led a team through a high-stakes analysis project by maintaining clear communication and assigning roles based on strengths.
How do you approach working with team members who are less quantitative or analytical in their approach?
I try to engage them with the broader context of the project and explain the significance of analytical findings in simpler terms.
Tell me about a time when you had to rely on your team to solve a complex problem.
Leveraged diverse skill sets within my team to collaboratively solve a complex data modeling challenge.
Adaptability and Problem-Solving
Describe a situation where you had to adapt to significant changes in the workplace.
I quickly adapted to remote working by utilizing digital collaboration tools and maintaining regular communication with my team.
Can you discuss a time when you had to solve a problem with limited resources or information?
Tackled a data shortage by creatively using proxy variables and synthetic data generation techniques.
How do you handle tight deadlines and high-pressure situations?
Prioritize tasks, maintain a calm approach, and communicate effectively under tight deadlines and high-pressure situations.
Share an example of how you have had to adjust your work approach to accommodate new data or a changing environment.
Adapted my analysis approach when presented with new data, ensuring the model’s relevance and accuracy.
Innovation and Creative Thinking
Can you give an example of an innovative solution you developed for a challenging problem?
Created a novel risk assessment tool by combining traditional financial metrics with machine learning techniques.
Describe a time when you had to think outside the box to complete a task or project.
Solved a data inconsistency issue by applying a non-traditional normalization approach.
How do you stay current with new quantitative techniques or technologies?
Regularly attend workshops, online courses, and collaborate with peers in the industry.
Share an experience where you applied a novel quantitative approach to a traditional financial problem.
Applied machine learning to improve the accuracy of credit risk assessment in a conventional banking system.
Conflict Resolution and Communication
Describe a situation where you had a disagreement with a supervisor or coworker and how you resolved it.
Addressed disagreements through open dialogue, focusing on data and objective analysis to reach a consensus.
How do you handle situations where your analysis or data is challenged by others?
I encourage constructive criticism and engage in open discussions to validate and improve my analyses.
Can you discuss a time when you had to deliver difficult feedback to a team member?
Provide clear, constructive feedback backed by specific examples and suggestions for improvement.
Describe how you would explain a complex quantitative concept to a non-technical audience.
Use analogies and simplify the terminology to make complex concepts more accessible to a non-technical audience.
Resilience and Learning from Failure
Tell me about a time when you failed at a task or project. What did you learn from that experience?
Analyzed the root causes of a project failure. Learned the importance of iterative testing and stakeholder feedback.
Can you share an example of how you bounced back from a setback at work?
Overcame a project setback by re-evaluating the strategy and implementing a more robust approach.
Describe a situation where you had to learn from criticism or negative feedback.
View criticism as a learning opportunity to improve my skills and approaches.
How do you handle and learn from rejection, such as a rejected research idea or project proposal?
Treat rejections as a chance to refine my ideas and align them more closely with organizational goals.
Career Motivation and Aspirations
Why did you choose a career in quantitative finance?
Drawn by the challenge of applying mathematical and statistical methods to solve complex financial problems.
Where do you see your career in the next five years?
I see myself as a lead quant, developing innovative strategies and mentoring a team of analysts.
How do your personal and professional goals align with this role and our company?
My analytical skills and passion for finance align well with roles involving complex financial modeling and data analysis.
What motivates you to excel in a quantitative role?
Driven by the intellectual challenge and the impact of my work on financial decision-making.
Ethical Judgment and Professional Integrity
Have you ever faced an ethical dilemma in your work? How did you handle it?
Addressed ethical dilemmas by adhering to professional ethics, seeking guidance from seniors, and prioritizing transparency.
How would you handle a situation where your analysis results might harm the company’s public image or valuation?
Would present findings factually while working with management to understand the broader implications.
Can you describe a situation where you had to uphold data confidentiality or professional ethics?
Always prioritize data security and adhere to ethical guidelines in my analysis.
How do you ensure the integrity and accuracy of your quantitative analyses?
Regularly validate my models against real-world data and peer-reviewed research to ensure accuracy and integrity.
Situational Judgement
If you were given a project with unclear goals or objectives, how would you proceed?
- Seek clarification
- Define project scope
- Set interim objectives to stay aligned with overall goals
How would you handle a situation where you are asked to complete a task beyond your current expertise?
Collaborate with more knowledgeable colleagues or seek external expertise while learning on the job.
Imagine a scenario where your key findings contradict the company’s current strategy. How would you present this information?
Present such findings objectively. Back them with data while being open to further discussion and analysis.
Describe how you would handle a high-stakes project with a tight deadline.
To meet the deadline efficiently:
- Prioritize tasks
- Streamline workflows
- Maintain clear communication
VI. Econometrics and Macroeconomics
Econometric Models: Explain the use of Vector Autoregression (VAR) in economic forecasting.
VAR models capture the linear interdependencies among multiple time series for macroeconomic forecasting.
Cointegration and Error Correction Models: How do you apply these in pairs trading?
Used to identify pairs of stocks that move together, enabling profitable trades based on convergence and divergence.
Market Microstructure: Discuss the role of liquidity in price formation.
Liquidity impacts price formation by affecting the ease and speed at which assets can be traded without significant price changes.
Financial Crises: Analyze the quantitative factors leading to a financial crisis.
Includes excessive leverage, liquidity shortages, and rapid shifts in investor sentiment.
Monetary Policy: How do central bank policies affect quantitative models?
Central bank policies like interest rate changes and quantitative easing directly impact asset prices and risk models.
Econometrics
Can you explain the concept of Granger causality and its application in financial modeling?
Used to determine if one time series can predict another, not implying true causation but a predictive relationship.
Discuss the use and limitations of linear regression in econometrics, especially in the context of financial data.
Widely used for its simplicity and interpretability, but limited by its assumption of linear relationships.
How do you test for stationarity in a time series, and why is this important?
Use unit root tests like ADF. Important because many statistical models assume time series stationarity.
Explain the concept of heteroskedasticity and how it can impact regression models.
Causes non-constant variance in error terms. Leads to inefficient estimates and invalid inference in regression models.
Describe a method for dealing with multicollinearity in a regression model.
Techniques include using ridge regression or removing highly correlated predictors.
Related: Multicollinearity
Time Series Analysis
How would you approach modeling and forecasting a financial time series?
Incorporate historical data trends and volatility patterns, using models like ARIMA or GARCH.
Discuss the differences between ARMA, ARIMA, and ARCH/GARCH models.
ARMA models stationary series, ARIMA includes integrated (differenced) series, and ARCH/GARCH model changing volatility over time.
Explain the concept of cointegration and its relevance in pairs trading strategies.
Identifies pairs of stocks that have a long-term equilibrium relationship for profitable trading strategies.
How do you handle seasonality in time series analysis for financial data?
Use seasonal decomposition or include seasonal dummy variables in the model.
What are the challenges of using high-frequency financial data in time series modeling?
Includes dealing with noise, data volume, and microstructure effects.
Panel Data and Cross-Sectional Analysis
Discuss the advantages of using panel data over cross-sectional data in financial econometrics.
Panel data allows for controlling individual heterogeneity and observing dynamics, offering richer insights.
Explain fixed effects and random effects models in the context of panel data.
Fixed effects control for time-invariant variables. Random effects assume individual-specific effects are random.
How do you address selection bias in cross-sectional financial studies?
Use techniques like propensity score matching or instrumental variable analysis.
What are instrumental variables, and how are they used in econometric models?
Used to address endogeneity by providing a source of variation that is correlated with the explanatory variable but not with the error term.
Describe a scenario where you would use a difference-in-differences estimation approach.
Compares the pre- and post-treatment effects on a treatment group versus a control group.
Macroeconomic Theory and Policy
How do macroeconomic factors influence financial markets?
Influence asset prices, investor sentiment, and overall market dynamics.
Discuss the role of monetary policy in shaping investment strategies.
Influences interest rates and liquidity, affecting asset valuations and trading/investment decisions.
Explain the impact of fiscal policy on bond markets.
Government spending and tax policies can impact bond yields and debt market dynamics.
What is the relationship between interest rates and currency values in global markets?
Higher interest rates typically strengthen a currency (all else equal) due to increased foreign capital inflows.
How do economic indicators like GDP, inflation, and unemployment rates affect stock market performance?
Affects corporate earnings prospects, investor confidence, and market sentiment.
Advanced Econometric Techniques
Discuss the application of vector autoregression (VAR) models in macroeconomic forecasting.
Captures interdependencies among economic variables to forecast macroeconomic conditions.
How do you use structural equation modeling in finance?
Used to understand complex relationships between financial variables and latent constructs.
Explain the concept of endogeneity and how you can address it in an econometric model.
Addressed using instrumental variables, simultaneous equations models, or panel data techniques.
What is the role of machine learning in modern econometric analysis?
Enhances predictive accuracy and can uncover non-linear relationships in financial data.
Describe a situation where you would use a non-parametric method in econometrics.
Useful when data doesn’t fit traditional parametric models, allowing more flexibility in analysis.
Financial and Economic Crises
How do you model financial market reactions to unexpected macroeconomic news or political events?
Use event study methodology and volatility models to assess market sensitivity to news.
Discuss the quantitative approaches to measuring systemic risk in the financial system.
Use network models, stress testing, and contagion analysis to evaluate systemic risk in the financial system.
Explain how financial crises can propagate through economies and how this can be modeled.
Simulate stress scenarios, contagion effects, and market dynamics under extreme conditions.
What lessons have been learned from past economic crises that impact current quantitative finance models?
Highlight the importance of liquidity management, risk diversification, and regulatory oversight.
How would you model the impact of a major geopolitical event on global financial markets?
Use scenario analysis and stress testing to assess potential market responses to geopolitical events.
VII. Strategic Thinking and Problem-Solving
Financial Engineering: How would you construct a synthetic asset using derivatives?
Combine various derivatives like options and futures to mimic the payoff structure of a desired asset.
Market Anomalies: Discuss a strategy to exploit a market inefficiency.
Identify anomalies through statistical analysis and develop strategies to capitalize on pricing discrepancies.
Portfolio Construction: How do you incorporate alternative data into portfolio construction?
Integrate non-traditional data sources, such as social media sentiment or economic indicators, to enhance predictive models and diversification.
Regulatory Compliance: Discuss the impact of regulations like MiFID II on quantitative strategies.
MiFID II increases transparency and investor protection, which may require adjustments in trading strategies and data handling.
Scenario Analysis: How would you model the impact of a major geopolitical event on financial markets?
Use scenario analysis to assess potential impacts on market volatility, asset correlations, and investment valuations.
Strategic Thinking in Finance
How would you approach creating a risk management strategy for a new financial product?
Evaluate potential risks using statistical analysis and create mitigation strategies tailored to the product’s characteristics.
Describe a time when you had to revise your strategy in response to market changes.
Quickly adapt investment strategies in response to market volatility or economic shifts, based on real-time data analysis.
How would you use quantitative methods to identify new investment opportunities?
Utilize advanced analytics and data mining techniques to uncover hidden patterns or undervalued assets in the market.
Discuss a time when a strategic decision you made led to a significant improvement in a project or product.
Implemented a machine learning model that significantly improved portfolio risk assessment and returns.
Explain how you would evaluate the potential success of a new trading algorithm.
Test the algorithm’s performance using historical data, simulated environments, and risk-return analysis.
Financial Modeling and Analysis
How would you build a model to predict the default probability of a bond?
Develop a model incorporating credit ratings, financial ratios, and market data to estimate default likelihood.
Describe the process of creating a valuation model for a company that has just announced a merger.
Combine discounted cash flow analysis with market comparables, adjusting for synergies and integration risks.
Explain how you would approach modeling the impact of political instability on currency markets.
Factor in currency volatility, capital flight risk, and changes in trade policies.
How would you modify your financial models to account for the introduction of new regulatory changes?
Update compliance rules, risk parameters, and reporting mechanisms in models to align with new regulations.
Discuss a complex financial model you’ve developed and how it impacted decision-making.
Developed an advanced derivative pricing model that informed more effective hedging strategies.
Problem-Solving in Quantitative Finance
Describe a particularly challenging problem you solved in your last role. What was your approach?
Overcame a data quality issue by developing a robust data cleansing algorithm, enhancing the model’s accuracy.
How do you approach troubleshooting a model that isn’t performing as expected?
Conduct a thorough diagnostic to identify and rectify underlying data or algorithmic issues.
Explain a time when you had to make a quick decision based on incomplete data.
Used probabilistic models and scenario analysis to make an informed decision.
Also emphasize in your answer the marginal benefits of collecting more information against the marginal costs of deciding.
Plus, how easy the decision would be to reverse.
Discuss a situation where you had to use unconventional methods to solve a financial problem.
Applied non-linear dynamic modeling to capture complex market behaviors, not addressed by traditional models.
How do you prioritize and tackle multiple tasks with competing deadlines?
Evaluate tasks based on urgency and impact, allocate resources efficiently, and adjust priorities as needed.
Scenario Analysis and Decision-Making
How would you assess the viability of entering a new market based on quantitative analysis?
Conduct market analysis using economic indicators, competitive landscape, and demand forecasting.
Describe how you would conduct a stress test on a portfolio.
Simulate extreme market conditions to evaluate the portfolio’s resilience to shocks and adjust strategies accordingly.
Explain a scenario where you had to choose between multiple investment options. How did you decide?
Analyzed risk-return profiles, market conditions, and alignment with strategic objectives to make the decision.
How would you use quantitative methods to prepare for a potential economic downturn?
Incorporate recession indicators into models, increase liquidity, and hedge against market downturns.
Discuss a time when you had to adjust your strategy based on scenario analysis results.
Revised investment allocations based on potential outcomes of geopolitical or economic scenarios.
Innovation and Creative Solutions
Can you give an example of an innovative quantitative method you proposed or developed?
Developed a proprietary algorithm for predictive analytics in commodity markets, enhancing trading efficiency.
How do you stay ahead of the curve in adopting new quantitative techniques?
Continuously explore emerging fields like AI and machine learning, and apply them to financial modeling.
Describe a situation where thinking creatively gave you a competitive edge in your analysis.
Utilized alternative data in a novel way to understand consumer trends ahead of the market.
Explain how you would approach a new problem for which traditional models are inadequate.
Structure the answer like:
- Break down the problem
- Explore various statistical methods, and
- Apply analytical techniques
Discuss a time when you identified a new application for an existing quantitative method.
Adapted a risk model from insurance to finance, significantly improving credit risk assessment.
Ethical Judgment and Decision-Making
Describe a situation where you had to make a difficult decision that involved ethical considerations.
Refused to manipulate data to favor a certain outcome, upholding data integrity and professional ethics.
How do you ensure that your quantitative analyses maintain integrity and ethical standards?
Regularly validate models against real-world outcomes and adhere to strict ethical guidelines in data handling and analysis.
Discuss a time when you had to balance profitability with ethical considerations in your analysis.
Refrained from exploiting a market vulnerability, prioritizing ethical standards over short-term gains.
Explain how you would handle a situation where your analysis results might be unpopular or controversial.
Present results transparently while preparing to discuss potential implications and alternative perspectives.
Describe your approach to making decisions that involve conflicting data or perspectives.
Analyze all angles, assess risks and benefits, and use a balanced approach to reach a decision.
Citadel Quant Interview Questions
You are at a shoe factory and need to create pairs of shoes in boxes. You have three pairs of shoes (a total of six shoes): two size fours, two size fives, and two size sixes. An “acceptable pair” is defined as two shoes that differ in size by at most one. For example, a size five and a size six shoe would be an acceptable pair. If you randomly create three pairs of shoes, what is the probability that all three pairs are acceptable?
The goal is to find the probability that all three randomly formed pairs are acceptable, meaning the size difference is one or less.
First, we find the total number of ways to pair six shoes. You can pair the first shoe with any of the other five, then a shoe from the next pair with one of the remaining three, and the last two form a pair.
This gives a total of 5 x 3 x 1 = 15 possible ways to create the pairs. Next, we count the favorable outcomes where no pair has a size difference greater than one.
There are only three such combinations: (4,4), (5,5), (6,6); or (4,5), (4,5), (6,6); or (5,6), (5,6), (4,4).
Any other combination would force a size 4 shoe to be paired with a size 6 shoe.
With 3 favorable outcomes and 15 total outcomes, the probability is 3 divided by 15, which simplifies to 1/5 or 20%.
__
You flip a fair coin until you get your first heads. If the first heads appears on the k-th flip, you receive k balls. These k balls are then randomly placed into three bins (labeled 1, 2, and 3). What is the probability that none of the three bins are empty?
We want the probability that none of the three bins end up empty.
This is solved using the Law of Total Probability.
The process depends on k, the number of the flip on which the first heads appears.
The probability of the first heads occurring on the k-th flip is (1/2) to the power of k.
Given k balls, the probability that none of the three bins are empty is zero if k is less than 3.
For k greater than or equal to 3, the probability is (3^k – 3*2^k + 3) / 3^k.
To find the total probability, we sum the product of these two probabilities for all values of k from 3 to infinity.
This summation breaks down into three geometric series. Solving these series gives the final probability as 1/4 – 1/6 + 1/60, which equals 6/60.
The final answer is 1/10 or 10%.
Jane Street Quant Interview Questions
1. Optimal Dice Rolling
You have a standard six-sided die and are allowed to roll it up to three times. Your score is the value of your final roll. You can choose to stop rolling at any point.
What is the optimal strategy to maximize your score, and what is the expected value of your score if you follow this strategy?
On the third and final roll, you have no more choices. You must accept the outcome. The expected value of this roll is the average of a standard die: (1+2+3+4+5+6)/6=3.5.
On the second roll, you should continue to the third roll only if the expected value of rolling again (3.5) is greater than your current roll.
Therefore, you should roll again if you get a 1, 2, or 3, and stop if you get a 4, 5, or 6.
The expected value at this stage is:
E2 = (3/6)(3.5) + (1/6)(4) + (1/6)(5) + (1/6)(6) = 1.75 + 2.5 = 4.25
On the first roll, you should continue to the second stage only if its expected value (4.25) is greater than your current roll.
Therefore, you should roll again if you get a 1, 2, 3, or 4, and stop if you get a 5 or 6.
The overall expected value of the game is:
E1 = (4/6)(4.25) + (1/6)(5) + (1/6)(6) = (17/6) + (11/6) = (28/6) = (14/3)
The optimal strategy is:
- Roll 1: Stop on a 5 or 6. Otherwise, roll again.
- Roll 2: Stop on a 4, 5, or 6. Otherwise, roll again.
- Roll 3: Accept the result
The expected value of the game following this strategy is 14/3, or approximately 4.67.
2. The Biased Coin Game
You and an opponent are playing a game with a biased coin. The coin has a probability p of landing on heads and 1-p of landing on tails. You take turns flipping the coin, with you going first. The first person to flip a heads wins the game.
What is the probability that you win the game?
This can be expressed as a recursive formula:
PW = p + (1−p)(1−p)PW
Now, we solve for PW:
PW = p + (1−p)^2 PW
PW − (1−p)^2 PW = p
PW (1 − (1−p)^2) = p
PW (2p − p^2) = p
Assuming p>0, divide both sides by p:
PW (2−p) = 1
The probability that you win the game is PW = 1/(2−p)
3. Market Making and Adverse Selection
You are a market maker for an asset that is currently priced at $50. At the end of the day, you know the asset’s price will either jump to $100 or fall to $0, each with a 50% probability.
Throughout the day, various traders can buy or sell one share of the asset with you. You can set your own bid price (the price you buy at) and ask price (the price you sell at).
Assume you are only trading with a single “informed” trader who knows exactly where the price will end up. If the price is going to $100, they will try to buy from you. If it’s going to $0, they will try to sell to you. They will only trade if it’s profitable for them.
What bid and ask prices should you set to maximize your profit, and what is your expected profit?
Let’s analyze your profit from the informed trader’s perspective:
If the price will be $100 (50% chance): The trader will only buy from you if your ask price is below 100. Your profit in this case would be (Ask − 100), which is a guaranteed loss.
If the price will be $0 (50% chance): The trader will only sell to you if your bid price is above 0. Your profit in this case would be (0 − Bid), which is also a guaranteed loss.
To avoid a guaranteed loss, you must set your prices such that the informed trader has no profitable trade to make. This means setting your bid at or below the lowest possible price and your ask at or above the highest possible price.
The optimal strategy is to set your market at:
- Bid Price: $0
- Ask Price: $100
At this spread, the informed trader cannot make a profit by trading with you, so no trades will occur.
Your expected profit is $0. Any “tighter” spread (e.g., Bid at $1 and Ask at $99) would guarantee you a loss.