20 Greeks to Know for Options Pricing [First-, Second-, and Third-Order Greeks]


In quantitative finance, and especially with respect to options pricing, Greek letters are used to relate the sensitivity of the option price to changes in the underlying parameters.
The five most familiar ones describe sensitivity to:
Traders simply call them “the Greeks.” You will also hear them labeled hedge parameters or risk measures. They’re relevant to all types of options pricing, no matter the underlying asset (stocks, bonds, currencies, commodities).
The Greeks aren’t predictions, but sensitivity estimates. They tell you how an option’s theoretical value may change if price, time, volatility, interest rates, or dividends change while other variables are held constant.
The real market rarely cooperates by moving one variable at a time. Price moves, volatility shifts, time passes, rates change, and all of it at once. The Greeks are some of the best means we have for decomposing that complexity into something a trader can act on.
This guide covers 20 Greeks across three orders, plus multi-asset (cross) Greeks, dealer hedging flows, strategy applications, and limitations.
You’ll understand not just what each Greek measures but how they behave, how they interact, when they matter, and where they can mislead you.
Key Takeaways – Options Greeks
| Greek | Measures | Most important for | Usually highest when |
|---|---|---|---|
| Delta | Price sensitivity | Directional exposure | Deep ITM options |
| Gamma | Delta sensitivity | Convexity, hedging risk | ATM near expiration |
| Theta | Time decay | Short-term options, income trades | ATM near expiration |
| Vega | Volatility sensitivity | Earnings, macro events, IV changes | ATM, longer-dated options |
| Rho | Interest-rate sensitivity | LEAPS, rate-sensitive products | Long-dated options |
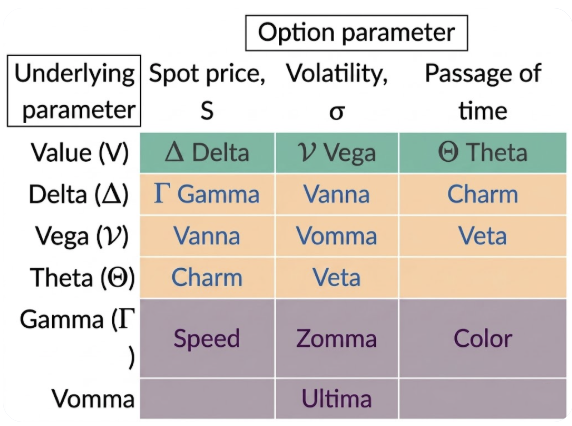
- The first-order Greeks (delta, theta, vega, rho) measure direct sensitivities to a single input.
- The second-order Greeks (gamma, vanna, charm, vomma, veta, vera) measure how the first-order Greeks change.
- The third-order Greeks (speed, zomma, color, ultima) measure how the second-order Greeks change.
- Each layer up adds precision. But, at the same time, complexity as well.
- Greeks are also derived from a pricing model, as they’re not observed as explicit variables. Different brokers and different platforms can show slightly different numbers for the same option. (We’ll come back to why that matters.)
Why Greeks Are Theoretical, Not Forecasts
The options industry’s educational material is explicit on this point: Greeks are theoretical guideposts, not guarantees of exact premium changes.
As mentioned, this is because every Greek is calculated under the assumption that all other variables are held constant.
- Delta assumes volatility, time, rates, and dividends are unchanged.
- Vega assumes price, time, rates, and dividends are unchanged.
- Theta assumes price and volatility don’t move.
Real markets violate all of those assumptions simultaneously.
Around an earnings release, an important data print, or a Fed decision, delta, gamma, theta, and vega can all change at once. An option that looked like it should gain $0.55 on a $1 move might lose money instead because implied volatility fell by three points at the same time.
This makes Greeks a framework, not an edge in themselves. Billions in institutional money has the same information.
Use them to understand the risk shape of a position. Don’t use them as a price prediction.
First-Order Greeks
These are the Greeks that measure direct sensitivity to one input. If you learn only these, you still have enough to manage most positions.
Delta
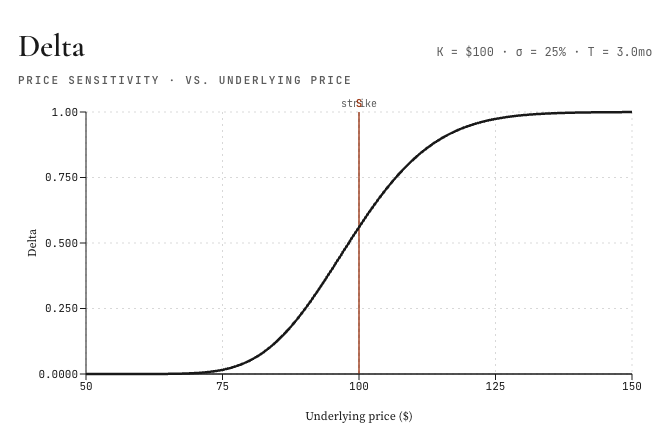
Delta is the most popular and fundamental Greek because it involves the sensitivity of an option’s price to the movement of the underlying.
Delta estimates how much an option’s theoretical price may change for a $1 move in the underlying asset, assuming other pricing inputs stay the same.
If delta is 0.524, that means for every one-dollar increase in the underlying asset, the option is expected to gain about $0.524 per share. Per standard options contract, which controls 100 shares, that is roughly $52.40.
A few rules always hold:
- Call options have positive deltas, between 0 and 1.
- Put options have negative deltas, between -1 and 0.
- Deep in-the-money (ITM) options have deltas close to 1 (or -1 for puts).
- Profit moves almost tick-for-tick with the underlying.
- Deep out-of-the-money (OTM) options have deltas near 0. They move very little when the underlying moves.
- At-the-money (ATM) options typically have deltas near 0.50 for calls and -0.50 for puts.
Delta has a second interpretation that traders use constantly. It’s an approximation of the probability that the option will finish in the money.
A 0.30 delta call is roughly a 30% chance of expiring ITM. That isn’t mathematically exact, but it’s close enough to be useful on the fly as a rule of thumb. Delta is also how traders quote “share-equivalent exposure.” If you own ten calls with a 0.60 delta, you have roughly 600 shares of long exposure. More on that in the portfolio Greeks section.
Theta
Theta measures the time decay of an option. It shows the amount a long option typically loses from one day of time decay, all else equal. For short option positions, that same decay works in the seller’s favor.
Theta is usually expressed as a negative number for long options. If theta is -0.06, the option is expected to lose about $0.06 per share per day if nothing else changes.
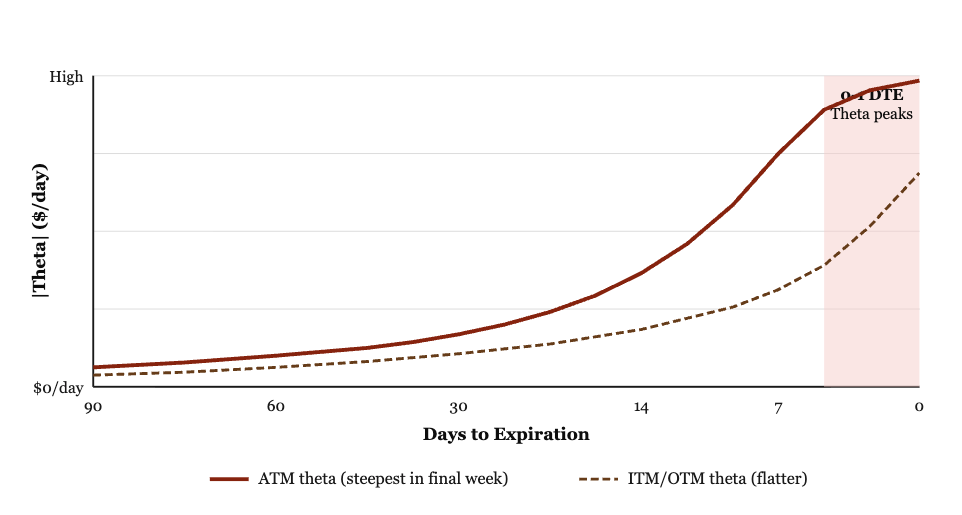
The behavior of theta isn’t linear over the life of an option.
Here’s the pattern:
For at-the-money options, theta accelerates as expiration approaches. The last few weeks of an option’s life are where the bulk of time decay occurs for ATM contracts.
For deep in-the-money or deep out-of-the-money options, theta actually decreases as expiration approaches. That seems counterintuitive at first. The reason is that extrinsic value (the time-value portion of the premium) is much smaller for ITM and OTM options than for ATM options. There’s simply less time value left to decay.
Longer-term options are therefore better for strategies that depend less on time decay to drive returns.
Shorter-term options are better for strategies that actively look to profit from accelerating theta, like short premium strategies and income trades. Naturally, these tend to be popular with day traders.
Note that different pricing platforms and models use slightly different time conventions (calendar days versus trading days, 365 versus ~252). The theta number on your screen may be computed per calendar day. Check the convention your platform uses before you build a strategy around it.
Let’s look at some other aspects of theta:
Time Value Over the Life of an Option
Time value bleeds out slowly at first, then collapses in the final weeks. The ATM curve loses value fastest in the home stretch because it has the most extrinsic value left to lose.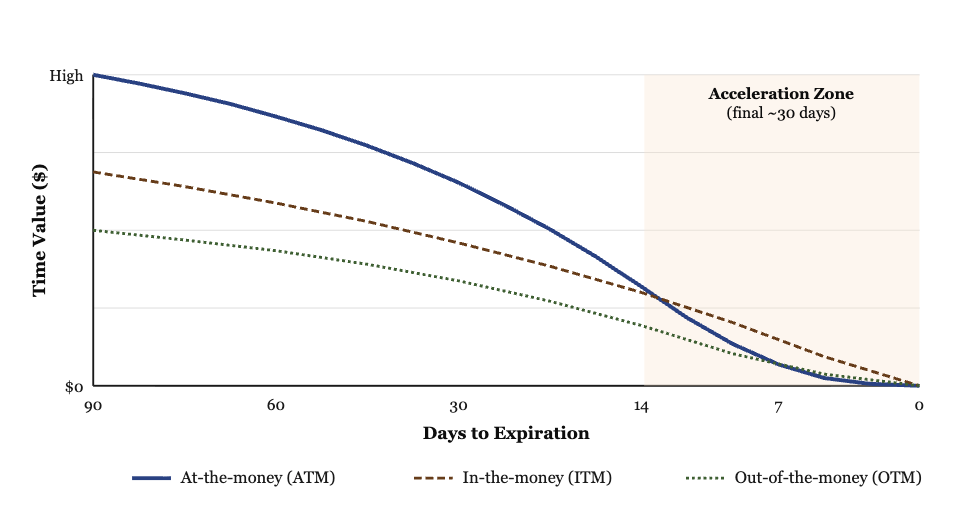
Theta Itself: The Daily Rate of Decay
Theta is the daily dollar amount the option loses to time.
It’s small far from expiration and explodes upward in the final days.
ATM options have the steepest theta because they hold the most extrinsic value.
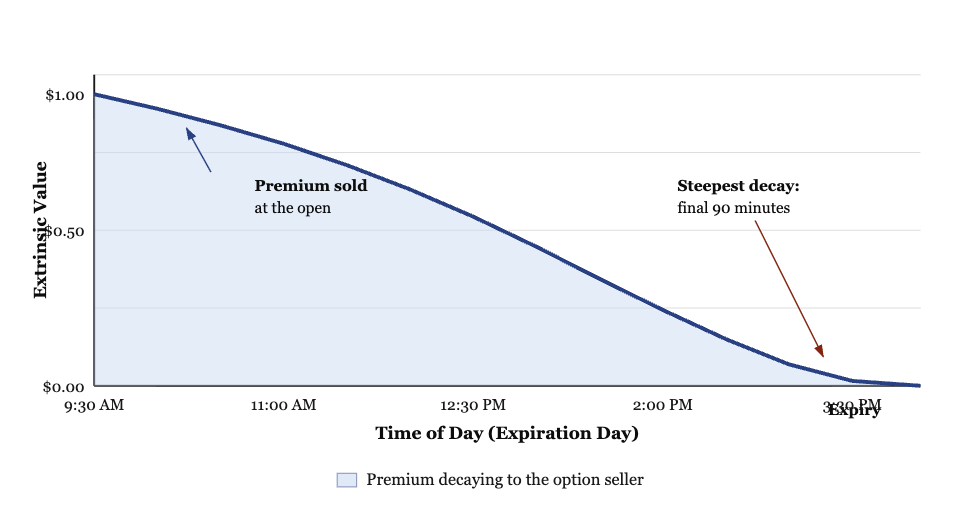
The Final Trading Session: Intraday Decay on Expiration Day
On expiration day, an ATM option’s extrinsic value collapses across a single trading session.
The seller harvests the entire shaded area, provided the underlying does not move enough to overwhelm the decay.
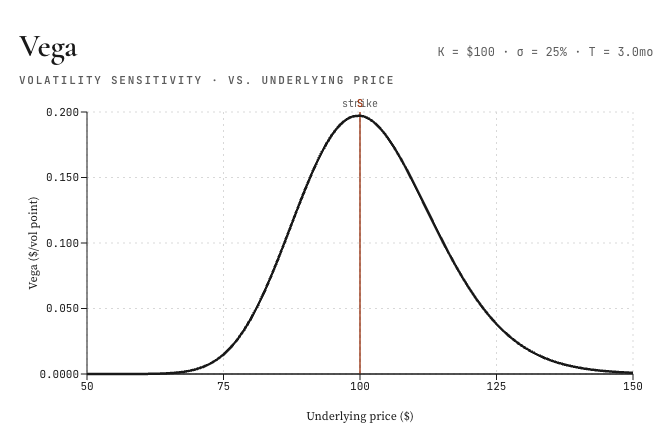
Vega
Vega measures the sensitivity of the option price to volatility.
If vega is 0.12, the option’s theoretical value is expected to move roughly $0.12 per share for each one-point change in implied volatility.
Vega and volatility are sometimes used interchangeably (because they both start with V), but they’re different. Volatility is the input (usually labeled sigma). Vega is the option’s sensitivity to that input.
An increase in implied volatility raises the price of both call and put options, which is good for the buyer. A decrease in implied volatility lowers the price of both (good for the seller).
Each option responds differently, and vega is how that difference is quantified.
Where is vega highest?
Vega is highest for at-the-money options and lower for deep ITM or deep OTM options (because volatility simply won’t affect its moneyness very much).
Vega also tends to be higher for longer-dated options. That is why LEAPS and other long-dated contracts are so sensitive to changes in the volatility environment.
Also, vega isn’t symmetrically distributed around the strike price. For a stock with a $100 strike, vega is typically higher at $105 than at $95, even though both prices are $5 away from the strike. The asymmetry comes from how the underlying price enters the pricing formula. For most retail applications, you just need to know the distribution is not even.
Theta and Vega Display in Brokers & Theta/Vega Ratio
In certain brokers, theta and vega are displayed on your interface automatically.
For example:
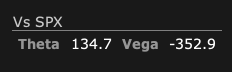
What do these numbers mean?
In short, it’s a portfolio-level Greek display showing aggregate theta and vega exposure measured against the SPX (S&P 500 index) as the reference underlying.
Here’s what each piece means:
“Vs SPX” tells you the Greeks are beta-weighted to the S&P 500.
Instead of reporting raw Greeks summed across whatever symbols the traders holds (e.g., AAPL options, SPX options, etc.), IBKR has translated them into “SPX-equivalent” exposure. Every position gets scaled by its beta to SPX so you can read the whole book through a single lens. This is standard practice for portfolio-level risk in options-heavy accounts.
Theta 134.7 means the portfolio is expected to gain about $134.70 per day from time decay, all else equal. Positive theta is the seller’s side. Here the trader is net short premium across the book. Every day that passes, ignoring everything else, the position earns roughly that amount as the options sold lose extrinsic value faster than the ones bought.
Vega -352.9 means a 1-point rise in implied volatility (across the relevant surface, expressed in SPX-equivalent terms) is expected to cost about $352.90. A 1-point drop would gain that amount. Negative vega is also the seller’s side. It means net short volatility.
The combination is the classic short-premium signature: collect theta, pay vega.
It’s the structure of iron condors, short strangles, credit spreads, naked short puts, and similar trades.
You make money slowly as time passes and the market sits still. You lose money quickly if implied volatility spikes or the underlying makes a sharp move.
That said, there are still a few things worth checking on this kind of display:
The numbers are aggregated in dollars per the standard convention (per 1-point IV move for vega, per calendar day for theta). Some brokers let you change the time decay convention in Trader Workstation (TWS) settings. Confirm whether your theta is calendar-day or trading-day before sizing trades around it.
Beta-weighting depends on the beta estimates IBKR is using. Those come from a rolling regression and can shift. The “Vs SPX” number is a useful summary, but it’s not a precise hedge ratio.
The ratio itself is informative. In this case, the theta-to-vega ratio is roughly 134.7 / 352.9 ≈ 0.38.
Said differently, one full point of IV expansion wipes out about 2.6 days of time decay. That’s a pretty typical short-premium book.
If IV jumps 5 points overnight on a market shock, it would lose roughly the next two weeks of theta in a single day, all else equal. Worth keeping in mind for position sizing.
Implied Volatility vs. Vega
This deserves its own beat because the confusion is semi-common.
Implied volatility is the market’s estimate of future volatility – based on what’s embedded in the option price. It’s an output of the market, derived by solving the pricing model in reverse.
Vega is how much the option price changes when implied volatility changes by one point.
Put another way:
- Implied volatility is what the option is “priced at.”
- Vega is how sensitive the option is to changes in that pricing.
A high implied volatility doesn’t automatically mean a good trade for, e.g., selling options.
The better question is whether implied volatility is expensive or cheap relative to the movement the underlying is actually likely to make. That’s the core of every volatility trade, from long straddles to short iron condors to every other structure conceivable.
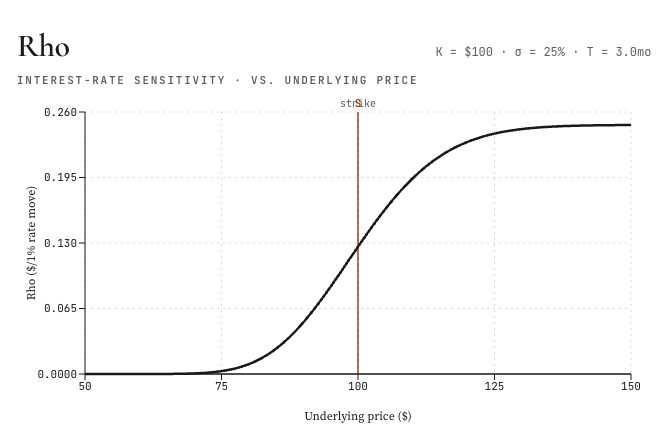
Rho
Rho is the rate at which the price of an option changes relative to the risk-free interest rate. Any change in interest rates, at any maturity along the yield curve, affects rho.
If an option has a rho of 0.05, a one percentage point increase in interest rates is expected to increase the option’s theoretical value by about $0.05 per share, all else equal. (Some platforms scale rho differently, so check the convention your platform uses.)
- Call options have positive rho: higher rates help call values.
- Put options have negative rho: higher rates hurt put values.
For most retail traders, especially day traders, rho is the Greek they think about least. On short-dated options, rho is tiny.
The exception is long-dated options, especially LEAPS, where rho becomes meaningful.
In a rising rate environment, the rho on a two-year call can add up to real dollars. In a falling rate environment, it can subtract them.
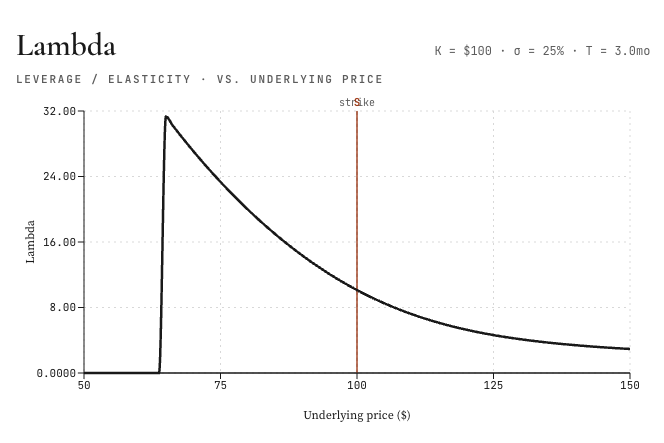
Lambda
Lambda, sometimes called omega or elasticity, is the percentage change in an option’s value per percentage change in the underlying price. It’s a measure of leverage, also called gearing.
If a stock moves 1% and the option moves 5%, lambda is 5. That’s the leverage figure. Traders use lambda to compare the “bang for the buck” of different option positions (i.e., capital efficiency, which is what options are commonly used for).
An option with a higher lambda offers more percentage exposure per dollar of premium paid. The upshot is that it also carries more risk per dollar.
Epsilon
Epsilon, also known as psi, is the percentage change in the option value per percentage change in the underlying dividend yield.
It measures dividend risk. In practice, the dividend yield impact is often expressed using a 10% change in the yield.
Epsilon only applies to derivatives of equity products where dividends are paid.
For most short-term options on non-dividend-paying stocks, you can ignore it. For long-dated options on high-dividend stocks, it matters, and the market prices it in.
How Greeks Work Together: A Full Example
Definitions are useful. Seeing them interact on a real position is better.
Let’s look a single worked example that shows how the first-order Greeks combine on one trade.
Suppose a call option on a stock trading at $100 has:
- Price: $4.00
- Delta: 0.55
- Gamma: 0.04
- Theta: -0.06
- Vega: 0.12
Now imagine three things happen over the next trading day:
- The stock rises from $100 to $101.
- One day passes.
- Implied volatility rises by one point.
What does the option’s theoretical value do?
From delta, the option gains about $0.55 on the $1 stock move.
From theta, the option loses around $0.06 from one day of time decay.
From vega, the option gains approx. $0.12 from the one-point IV increase.
Net change = roughly +$0.61.
The option moves from $4.00 to roughly $4.61.
Now the gamma effect. Before the move, delta was 0.55. Gamma of 0.04 means that after a $1 move, delta has climbed to roughly 0.59. The position is now more directional than it was at the start of the day. If the stock rises another $1 tomorrow, you’ll get closer to $0.59 from delta, not $0.55. That’s convexity at play. It’s why long options behave the way they do in a trend.
This is the interaction that matters.
- Delta tells you the current slope.
- Gamma tells you how fast the slope is changing.
- Theta tells you what you are paying (or earning) per day to hold the position.
- Vega tells you what happens if the volatility environment shifts.
The Greeks are a system, not a set of isolated numbers.
How Greeks Change by Moneyness and Expiration
The Greeks are dynamic. They shift as the stock moves, as time passes, and as implied volatility changes.
Here is the shape of those shifts.
| Option type | Delta | Gamma | Theta | Vega |
|---|---|---|---|---|
| Deep ITM | High (near 1 or -1) | Low | Lower than ATM | Lower than ATM |
| ATM | Around 0.50 / -0.50 | Highest | Highest decay | Highest |
| Deep OTM | Low (near 0) | Low | Low in dollars | Low |
| Near expiration | More unstable | Can spike near ATM | Accelerates | Often falls quickly |
| Longer expiration | Smoother | Lower near-term gamma | Slower decay | Higher vega |
A few patterns are worth internalizing.
Gamma peaks at the money, especially as expiration approaches. This is why short-dated ATM options have such explosive behavior. A small move in the underlying can send delta from 0.40 to 0.70 in a day. That is gamma doing its work.
Theta accelerates for ATM options near expiration. A short premium seller who holds through the last week of an option’s life captures the bulk of the decay, but they also bear the highest gamma risk during that window. There is no free lunch. High theta and high gamma live in the same neighborhood.
Vega is highest for longer-dated, ATM options. That is the combination that makes LEAPS so sensitive to volatility shifts. It’s also why volatility traders often prefer longer-dated straddles: more vega per contract.
Deep ITM and deep OTM options have low gamma and low vega. Their delta is close to 1 or close to 0, and it does not change much with small moves in the underlying. That stability is a feature, not a bug, for certain strategies.
Second-Order Greeks
Second-order Greeks take the derivatives of the first-order Greeks. They measure how the Greeks themselves change when inputs move.
That sounds more abstract than first-order Greek. But in practice, it tells a trader how stable their hedge is.
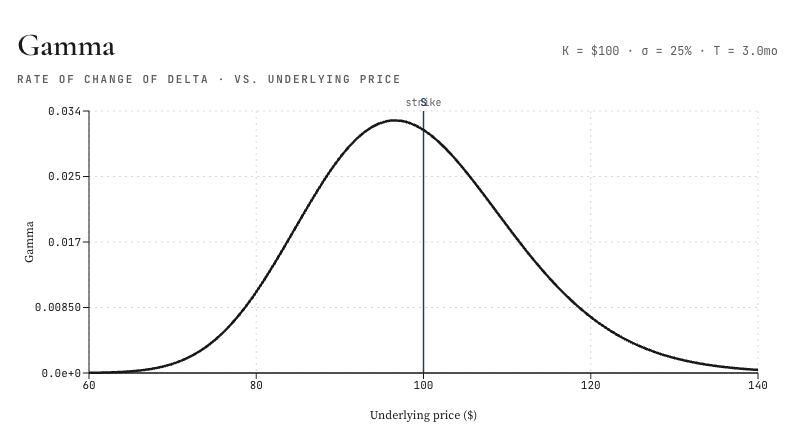
Gamma
Gamma shows the rate of change of delta as the price of the underlying changes. It’s the derivative of delta with respect to the underlying price.
Gamma is the second derivative of the option value function with respect to price. It’s the convexity of the position.
Gamma is highest for options that are at-the-money. It falls off for very deep ITM and very deep OTM options, where delta is already near its extremes and is not going to change much.
Most long options have positive gamma. Most short options have negative gamma. That matters because:
- Long gamma means your delta moves in your favor as the stock moves. Delta rises on a rally, falls on a sell-off. The position gets more long as prices rise and less long as prices fall.
- Short gamma means your delta moves against you. Delta falls on a rally (you become less short), rises on a sell-off (you become more short). You end up on the wrong side of every move.
When traders try to delta-hedge a position, they often try to neutralize gamma as well. Delta hedging alone works well for a narrow range of price movement. Once the stock has moved enough that gamma has shifted the delta meaningfully, the hedge is no longer effective. Gamma hedging corrects for that convexity.
When traders talk about a gamma squeeze they’re talking about a feedback loop where heavy call buying forces options market makers to buy the underlying stock to hedge. As the stock rises, their hedging demand can increase, pushing the price higher and attracting more speculative buying and momentum flows. “The tail wags the dog” is a common analogy, as instead of the stock driving the options prices, the options affect the underlying stock.
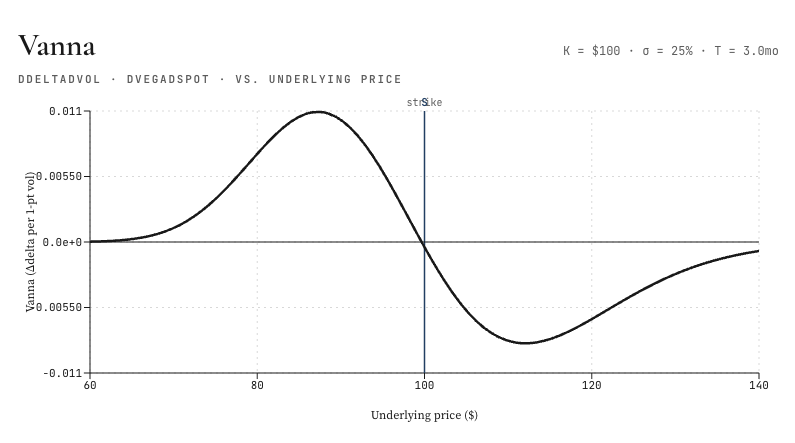
Vanna
Vanna is the rate of change of an option’s vega per 1-point move in the underlying price. It’s also the rate of change of delta per 1-point move in implied volatility. Both are correct. Vanna is a cross-sensitivity.
You’ll see it written as DvegaDspot or DdeltaDvol, which describes it more literally. It’s a second-order derivative, taken once with respect to the underlying price and once with respect to volatility.
Why does vanna matter? Because it tells you how a delta hedge decays as volatility changes, and how a vega hedge decays as the underlying moves.
A trader who is running both a delta hedge and a vega hedge can’t ignore vanna. If implied volatility jumps, vanna tells you how much your delta has shifted without the stock having moved at all.
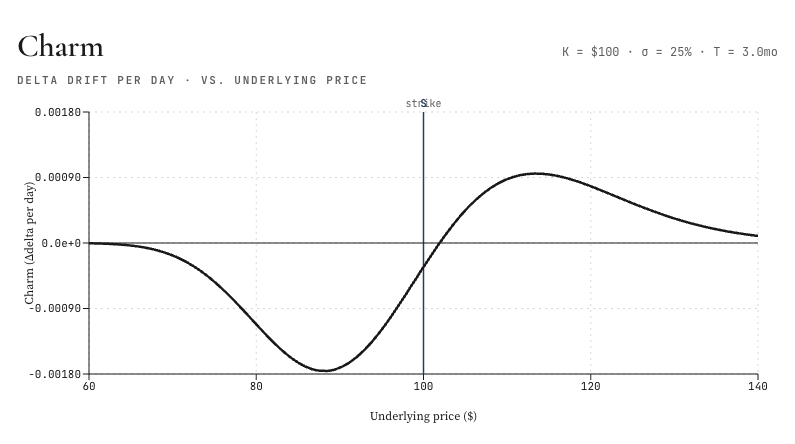
Charm
Charm is the rate of change of delta with respect to the passage of time. It’s also called more literally DdeltaDtime.
Charm is a second-order derivative of the option value, taken once with respect to price (giving delta) and once with respect to time (giving theta). Equivalently, it’s the derivative of theta with respect to the underlying price.
Why does this matter? Delta hedgers care about charm whenever markets are closed for an extended period. A long weekend, a holiday break, some type of exchange closure. Over those windows, time passes, but prices are locked until the exchange opens again. Delta drifts because of charm alone.
A trader running a delta-neutral book at the Friday close can come back on Tuesday to find the book is no longer neutral, simply because charm has moved the deltas.
Charm is expressed in delta per year. Dividing by the number of days to expiration gives a rough delta-decay-per-day figure. That approximation is reasonable when expiration is far off. Near expiration, charm itself moves around quickly, and the approximation breaks down.
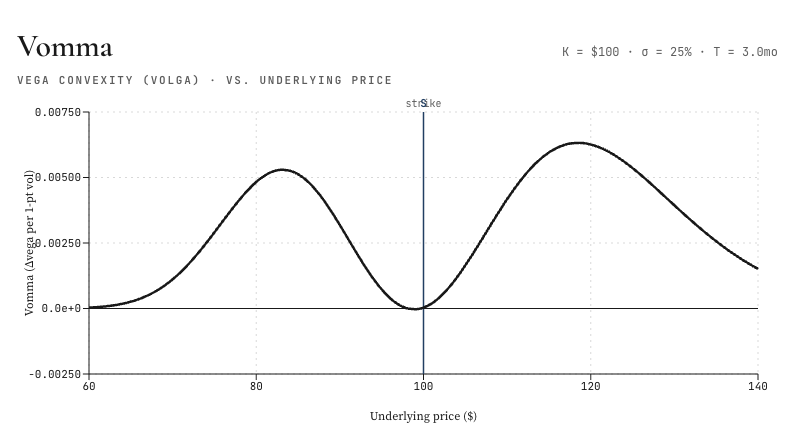
Vomma
Vomma is also called volga, vega convexity, or DvegaDvol.
It measures the rate of change of vega with respect to volatility. The second-order sensitivity of the option value to volatility.
Under positive vomma, a position becomes longer vega as implied volatility rises and shorter vega as implied volatility falls. That’s convexity in the volatility dimension. It’s analogous to gamma, which is convexity in the price dimension.
Some traders try to scalp vomma the way others scalp gamma. The typical setup is a vega-neutral, long-vomma position, built from ratios of options at different strike prices.
It’s a very hard trade to execute by hand. You need software to track exposures in real time and the ability to move in and out of positions quickly.
Vomma is positive for long OTM options and initially increases with distance from the money, then drops off as vega itself fades.
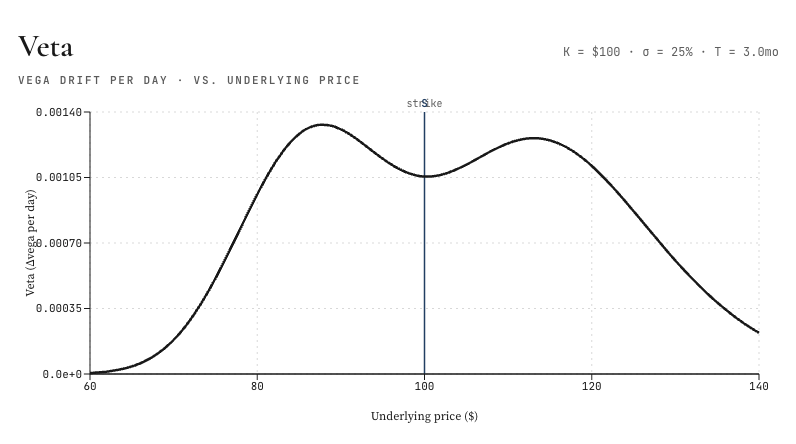
Veta
Veta, also called DvegaDtime, measures the rate of change of vega with respect to the passage of time. Second derivative of the option value, once to volatility and once to time.
Why does a trader care? Because a vega hedge that’s perfect today isn’t perfect tomorrow. Veta quantifies the drift.
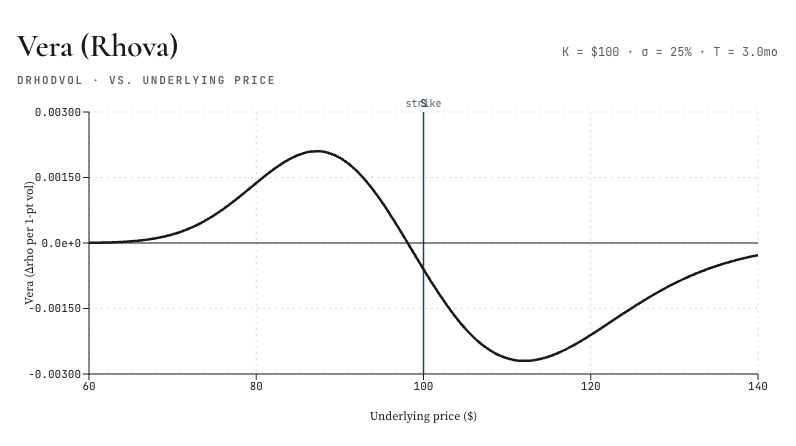
Vera (Rhova)
Vera, sometimes called rhova, measures the rate of change of rho with respect to volatility. Second derivative of the option value, once to volatility and once to interest rate.
Vera is the least popular of the second-order Greeks because rho itself is rarely a dominant risk in most positions.
Vera hedging is nowhere near as common as gamma hedging. The term “vera” was coined in 2012 as a mashup of vega and rho when traders needed a label for DrhoDvol. “Rhova” is the alternative. Vera caught on because it reads like a proper Greek cousin to vega and veta.
Third-Order Greeks
Third-order Greeks are the derivatives of the second-order Greeks. You hear about them less often because they’re harder to trade, they create unwanted exposures in other Greeks and shift risk elsewhere, and most of the risk they describe can be managed through other means.
Still, they exist and they matter for institutional books.
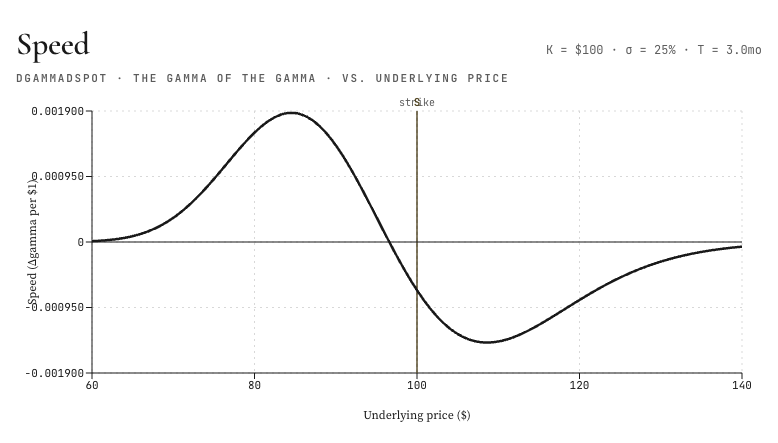
Speed
Speed is also called DgammaDspot, or “the gamma of the gamma.” It’s the third derivative of the option value with respect to the underlying price. Delta, then gamma, then speed.
Speed matters when a trader is running a delta or gamma hedge and wants to understand how quickly the gamma itself is changing as the stock moves.
Near-the-money, short-dated options can have enormous speed. The gamma profile changes rapidly as the stock walks past the strike.
You rarely hear of a “speed hedge” in the wild. Hedging against speed tends to create unwanted exposures in other Greeks (vega, delta), so most traders just monitor speed as a risk indicator rather than hedging it explicitly.
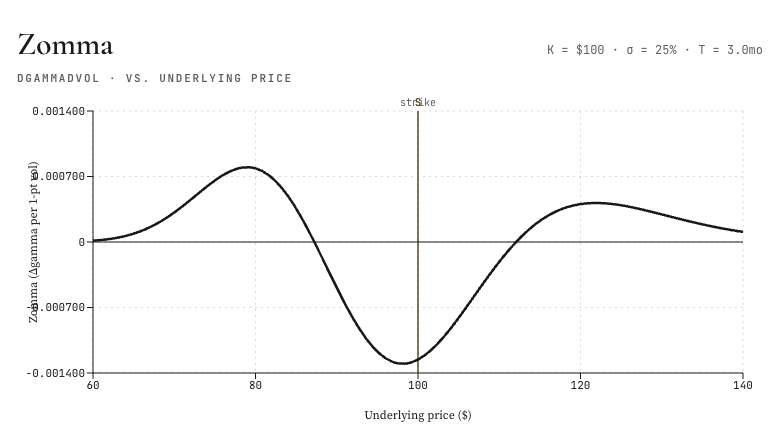
Zomma
Zomma is sometimes called DgammaDvol. It’s the third derivative of the option value, twice with respect to price (which gives gamma) and once with respect to volatility.
For a trader running a gamma-hedged book, zomma measures how the effectiveness of the gamma hedge changes as volatility moves. A volatility shift can quietly undermine a gamma hedge, and zomma is the number that tells you how fast.
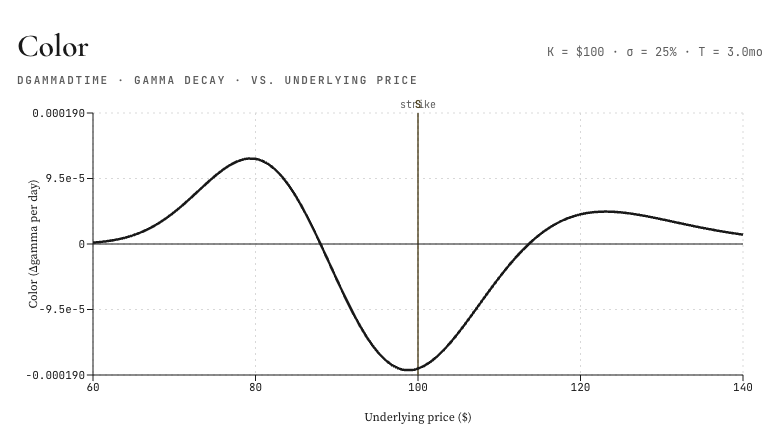
Color
Color, also called gamma decay or DgammaDtime, measures the rate of change of gamma with respect to the passage of time. Third-order derivative of the option value, twice to delta (once to gamma) and once to time.
Gamma-hedging traders use color to monitor how their hedge drifts over time. Color is expressed in gamma per year. Dividing by 365 gives a rough gamma-decay-per-day.
As with charm, the approximation works well when expiration is far off and breaks down as expiration approaches.
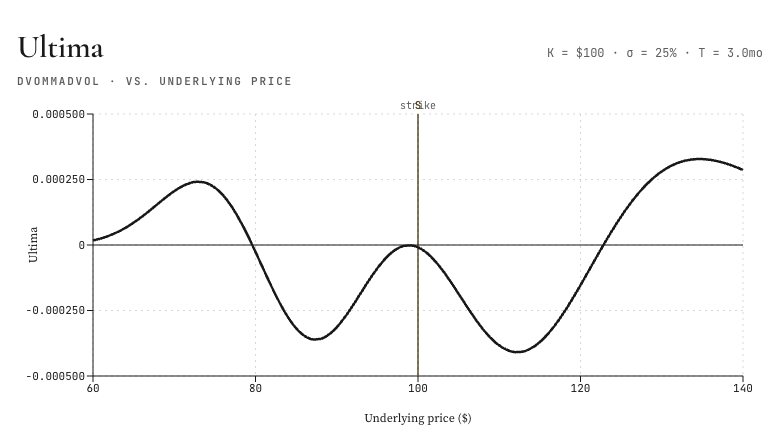
Ultima
Ultima, also called DvommaDvol, measures the sensitivity of vomma with respect to volatility. It’s the third-order derivative of the option value with respect to volatility. Volatility, then vega, then vomma, then ultima.
Ultima is a long way down the chain. It matters mostly for traders running complex vol books who need to understand the stability of their vomma exposures. For a retail trader, ultima is informational at best.
Are There Fourth-Order Greeks?
Yes. Fourth-order Greeks exist, but they’re rarely used outside advanced/more theoretical options modeling, exotic derivatives, and risk systems.
They measure how third-order Greeks change when inputs like the underlying price, volatility, time, or rates change.
In practice, most traders focus on first- and second-order Greeks, while third- and fourth-order Greeks are mainly useful when positions are large, nonlinear, path-dependent, or exposed to certain volatility changes.
Sophisticated vol traders often venture into third-order.
A simple hierarchy:
| Order | Examples | What they measure |
|---|---|---|
| First-order | Delta, Vega, Theta, Rho | Direct sensitivity to price, volatility, time, or rates |
| Second-order | Gamma, Vanna, Vomma/Volga, Charm | How first-order Greeks change |
| Third-order | Speed, Color, Ultima, Zomma | How second-order Greeks change |
| Fourth-order | Sometimes unnamed or model-specific | How third-order Greeks change |
Examples of fourth-order sensitivities could include:
| Fourth-order concept | Meaning |
|---|---|
| Change in speed as stock price changes | How fast gamma’s curvature itself is changing |
| Change in color as time passes | How gamma decay is accelerating or slowing |
| Change in ultima as volatility changes | How the convexity of vega exposure changes under further volatility movement |
| Mixed fourth derivatives | Sensitivities involving combinations of price, volatility, time, and rates |
The reason fourth-order Greeks are uncommon is practical: they’re often unstable, model-dependent, hard to interpret, and noisy.
For plain-vanilla options, they usually add little actionable value compared with delta, gamma, vega, theta, vanna, charm, vomma, speed, and color. And as we mentioned, even with third-order Greeks, creating hedges with them often shifts risk into other exposures.
So yes, mathematically there are fourth-order Greeks. But they’re not standardized in the same way as the major Greeks. They’re mostly institutional risk-management measures rather than everyday trading metrics.
Multi-Asset Options Greeks (Cross Greeks)
When a derivative’s value depends on two or more underlyings, the Greeks extend. The extended versions are called correlation Greeks or cross Greeks.
They describe how the Greeks of one underlying are affected by the price or volatility of another.
This matters for basket options, quanto options, spread options, dispersion trades, and structured products. They matter less for a trader who only ever buys puts/calls on single assets.
Correlation Delta (Cega)
Correlation delta, also called cega, measures the change in the value of a derivative when the correlation between two underlyings changes. If you’re long an option whose payoff depends on two stocks moving together, a drop in correlation can hurt you even if neither stock moved in an unfavorable direction.
Correlation Gamma (Cross Gamma)
Correlation gamma measures how the delta of an option changes when the correlation between two underlyings shifts.
It’s used to manage a delta hedge on a multi-asset book when correlations aren’t stable.
Correlation Vanna (Cvanna)
Correlation vanna, also called cvanna, measures how the vega of an option on one underlying changes when the price of the other underlying moves.
Equivalently, it measures how the delta in the second underlying changes due to a shift in the volatility of the first. It’s designed to manage a vega hedge on a multi-asset book.
Correlation Veta (Cross Veta)
Correlation veta (sometimes called correlation volga in related contexts) measures the rate of change of vega in one underlying with respect to the volatility of another underlying. It’s the volatility cross-sensitivity.
Why cross Greeks matter
Correlations shift. Assets that move separately in calm markets often correlate more during left-tail events when you need diversification most.
When correlation changes, every multi-asset Greek hedge that was set up under the old correlation assumption is then miscalibrated.
A trader running a delta- and vega-hedged multi-asset book uses cross Greeks to understand what happens when correlation shifts, and to adjust hedges before the P&L reflects the miscalibration.
For a single-leg option trader, the cross Greeks are nice-to-know. But for a structured products desk, they are the job.
Greeks, Market Makers, and Hedging Flows
You will hear traders and financial journalists talk about “flows” or “dealer positioning” or “gamma exposure.” These terms all describe the same underlying phenomenon: the hedging activity that market makers undertake as the Greeks on their books change.
The logic runs like this…
- A market maker sells options to customers. That creates a position with specific Greek exposures.
- To stay risk-neutral, the market maker hedges in the underlying.
- As the Greeks shift (because the stock moved, because time passed, because volatility changed, because rates changed, etc.), the hedge has to be updated.
- Updating the hedge means buying or selling the underlying. That buying and selling shows up as flows and positioning changes in the market.
Here is how each Greek translates into flow.
Spot Price (S) Related Flows
Delta. When delta changes because the underlying moved, market makers buy or sell the underlying to maintain a delta-neutral book. Large customer-driven shifts in delta produce mechanical, predictable buying or selling in the underlying.
Gamma. Gamma hedging means re-hedging delta repeatedly as the underlying moves. Large gamma exposures, especially short gamma exposures, can force dealers to chase the market. When dealers are short gamma, they buy into rallies and sell into declines. That is the dynamic behind what traders call a “gamma squeeze.” When dealers are long gamma, they sell into rallies and buy into declines, which tends to dampen price moves as it’s counter the prevailing trend in the market.
Speed. Speed drives the pace at which gamma itself changes. In the neighborhood of a strike with heavy open interest, speed can make dealer hedging activity ramp up rapidly. It’s one of the reasons prices pin to strikes near expiration.
Volatility (σ) Related Flows
Vega. When implied volatility shifts meaningfully, vega exposures change. Dealers then trade options or other volatility instruments to re-hedge. A vol spike on one underlying can produce hedging flow in correlated volatility products.
Vanna. A change in implied volatility moves delta through vanna. In turn, this forces delta re-hedging even if the underlying hasn’t moved. This is one of the mechanisms behind “vanna flows” that institutional traders watch during periods of changing volatility.
Vomma, Zomma, Ultima. These higher-order volatility Greeks describe how vega itself, how gamma, and how vomma respond to volatility changes. The flows from these are usually small individually. But they compound during certain shifts in markets.
Passage of Time (t) Related Flows
Theta. The shape of the option book changes as expiration approaches. Dealers have to constantly adjust hedges – i.e., because of the shifting delta and gamma profile that time decay produces.
Charm. Over weekends and holidays, delta drifts due to charm alone. When the market reopens, dealers rebalance. This is why you sometimes see unexplained activity at the open following a long weekend even when there’s no new news or data to speak of. It’s particularly true in heavily-traded single-stock names.
Veta. Vega drifts over time through veta. So vega hedges require ongoing maintenance.
Color. Gamma decays over time through color, which means gamma hedges require ongoing maintenance too.
The takeaway: When you hear people talk about “dealer flows,” they are describing the mechanical hedging activity that the Greeks force. It’s not the more nebulous terms that supposedly drive market movements, like speculation or sentiment. It’s math working itself out through the order book.
Greeks by Options Strategy
Knowing the Greeks is one thing. Knowing which Greeks matter most for a given strategy is how you actually use them. Here is a practical map.
| Strategy | Main Greeks to watch | Why |
|---|---|---|
| Long call or put | Delta, theta, vega | Needs direction, loses time value, benefits from IV rise |
| Covered call | Delta, theta | Income trade with capped upside; watch assignment risk |
| Cash-secured put | Delta, theta, vega | Income plus downside stock exposure |
| Vertical spread | Delta, theta, gamma | Defined-risk directional exposure |
| Calendar spread | Theta, vega | Sensitive to time decay and IV term structure |
| Straddle or strangle | Vega, gamma, theta | Bets on movement and/or volatility |
| Iron condor | Theta, gamma, vega | Benefits from range-bound markets but vulnerable to sharp moves |
| LEAPS | Delta, vega, rho | Longer duration makes volatility and rates more relevant |
| Ratio spread | Delta, gamma, vega | Non-standard payoff profile needs full Greek analysis |
| Diagonal spread | Theta, vega, delta | Term-structure trade with directional bias |
A few quick principles:
- Directional traders focus on delta and gamma.
- Delta tells them how much exposure they have.
- Gamma tells them how that exposure changes as the stock moves.
- Premium sellers focus on theta, gamma, and vega.
- Theta is their friend.
- Gamma is their enemy.
- Vega depends on the environment they sold into.
- Volatility traders focus on vega, vomma, and the volatility term structure. They care less about direction.
- Long-term position traders focus on delta and vega, with rho gaining importance as duration extends.
Portfolio Greeks
Greeks aren’t just per-option numbers but aggregate. Once you hold more than one position, the Greeks on the overall book are what actually describe your risk.
A trader who owns ten calls with delta 0.60 has roughly 600 shares of delta exposure. Each contract controls 100 shares, so the math is ten contracts times 100 shares times 0.60 delta.
If the trader also holds short calls, long puts, and spreads, the net delta, gamma, theta, vega, and rho of the portfolio can all be calculated by summing the Greeks across positions, contract by contract.
Here is a simple example.
| Position | Contracts | Delta per contract | Share-equivalent delta |
|---|---|---|---|
| Long call | 5 | 0.60 | +300 |
| Short call | 2 | 0.40 | -80 |
| Long put | 3 | -0.35 | -105 |
| Net | +115 |
Net delta: +115 shares of exposure. The trader is mildly long.
The same aggregation works for gamma, theta, vega, and rho.
A portfolio that looks delta-neutral can be wildly exposed to gamma or vega depending on which positions are doing the canceling.
This is why institutional risk systems track Greeks at the portfolio level, not just the position level. You can have a book where each individual trade looks fine, while the aggregate Greeks are telling you the whole book will have a problem if volatility spikes.
0DTE and Short-Dated Options
0DTE options have become popular among retail day traders because they provide stronger leverage with the theta severely decayed.
Zero-days-to-expiration options (0DTE) and very short-dated options behave in ways that the textbook Greek descriptions understate.
Time is compressed. Everything moves faster.
For 0DTE and short-dated options:
- Gamma can become enormous near the strike. A few cents of movement in the underlying can swing the option price dramatically.
- Delta can change rapidly. An option that was a 0.30 delta at the open can be a 0.70 delta or a 0.05 delta by lunch.
- Theta decay is compressed into hours, not weeks. Holding a long ATM option through the final hours of its life is expensive.
- Small underlying moves can produce enormous percentage changes in option value. A $0.20 option can become $0.60 or zero in minutes.
- Dealer hedging flows matter more when open interest is concentrated near major strikes. The 0DTE market on major indexes has produced visible intraday pinning and gamma-driven moves in recent years.
The Greeks still apply. They just apply faster and with sharper edges.
A trader who understands gamma in a normal three-week ATM option needs to internalize that the 0DTE version of the same dynamic is on a compressed clock, with less room for error.
Short-dated trading isn’t inherently better or worse than longer-dated trading. The Greeks you watch are the same. How quickly you watch them is different.
Earnings, Implied Volatility, and IV Crush
Earnings releases – or big data points, in general – are the single most common situation where the Greeks tell one story and the P&L tells another.
A stock can move exactly the direction you predicted and your long option can still lose money. Understanding why requires looking at the Greeks before and after the event.
Before earnings:
- Implied volatility tends to rise on the batch of options that expire after the release, sometimes dramatically. Vega-driven price appreciation inflates the option premiums.
- Theta looks expensive because the event premium is embedded in the option. The market is essentially charging you for the expected post-earnings move.
- Gamma can be valuable if the stock moves in a big way after the print.
After earnings:
- Implied volatility usually collapses. This is “IV crush.” The event risk is over, so the market’s volatility estimate deflates with no other new news or data on the horizon.
- Long options can lose money even when the stock moves favorably, because the vega hit from IV crush can exceed the delta gain from the price move.
- Short premium trades benefit from IV crush but carry gap risk.
- A stock that moves further than the implied move wipes out the IV crush gain and more.
Put another way: the market prices earnings events. You’re not getting “free” exposure to the move. You are paying for it through elevated implied volatility. If the stock doesn’t move more than the implied move, long options lose. If the stock moves more than the implied move, long options win. IV crush is simply the volatility part of the pricing deflating after the event passes.
The practical rule for earnings: know what the implied move is. Compare it to the stock’s historical post-earnings move, but factor in current reality. Decide whether the market is overpricing or underpricing the event. Then pick a structure that fits your view if you feel you have an edge.
Why Greeks Differ Between Brokers
A question that comes up constantly: why does the same option show different Greeks on different platforms?
The answer is that every platform computes Greeks from a pricing model, and the inputs to that model vary.
Specifically:
- Implied volatility assumption – Different platforms derive IV from slightly different market prices (mid versus last versus bid/ask) and use different interpolation methods.
- Interest rate input – Some platforms use the Treasury curve, some use SOFR, some use a constant rate.
- Dividend assumptions – Dividend projections vary, especially for long-dated options.
- Exercise style – American options (which can be exercised early) require different models than European options (which can only be exercised at expiration).
- Pricing source – Mid-price versus bid versus ask changes the implied volatility, which in turn changes every Greek derived from it.
- Real-time versus delayed data – A Greek calculated on a 15-minute-delayed quote is different than one calculated on the current market.
The differences between platforms are usually small. They can matter at the margin for traders running tight hedges.
For a retail trader, the practical rule is to pick one platform and learn how it computes Greeks. Try not to cross-reference Greeks from multiple platforms.
The Greeks and Option Pricing Models
Greeks are derived from pricing models. The most common ones:
- Black-Scholes – The classic closed-form model for European options. Fast. Widely used. Assumes constant volatility, which isn’t true in practice.
- Binomial models – Tree-based models used for American options and options with early-exercise features. Slower but more flexible.
- Local volatility models – Allow volatility to vary with price and time. Useful for matching the observed volatility surface.
- Stochastic volatility models – Treat volatility itself as a random process. Heston and SABR are common examples. Capture the smile and term structure better than Black-Scholes.
- Market-maker and broker proprietary models – Most major options desks run their own models, often hybrids that incorporate features of the above with proprietary calibrations.
The model matters because the Greeks are its outputs. A Black-Scholes gamma will be slightly different from a stochastic volatility gamma on the same option. Neither is “wrong.” They’re different lenses. Most retail platforms use Black-Scholes or a variant, so most retail-facing Greeks are consistent with each other.
Related
Limitations of the Greeks (What They Don’t Tell You)
The Greeks do many things well. But they’re not complete.
A trustworthy view of options risk has to account for what the Greeks miss.
- Bid-ask spreads – Greeks are theoretical. The actual price at which you can buy or sell has a spread. On illiquid options, the spread can eat the entire theoretical edge.
- Liquidity – An option with a 0.50 delta that can’t be sold at the bid is worth less than one that can.
- Assignment risk – American-style options that most people are familiar with can be exercised early. Deep ITM short calls on dividend-paying stocks are prime candidates. The Greeks don’t warn you about this. (Related: Mathematical Modeling of American vs. European Options)
- Early exercise risk – Related but broader. Any short option position carries the risk of being assigned before expiration.
- Pin risk – At expiration, an option exactly at the strike creates uncertainty about whether it’ll be exercised. Pin risk is a real operational issue for market makers – and traders who have options at the strike. This may cause some traders to incur transaction costs to get out of it to avoid dealing with that specific issue.
- Hard-to-borrow effects – If the underlying stock is hard to borrow, put prices can reflect that friction in ways standard Greeks don’t capture.
- Dividend and ex-dividend effects – Known dividends can cause predictable discontinuities in option prices that the Greeks model only imperfectly. As dividends are a cash distribution, they leave a gap in the stock price (all else equal).
- Volatility skew – Implied volatility is different across strikes. OTM puts typically have higher IV than OTM calls. The Greeks for a single option don’t tell you what the skew is doing.
- Term structure – Implied volatility varies across expirations. A flat front-month vol with a steep back-month vol tells you something about the market’s expectations that single-option Greeks obscure.
- Model risk – The Greeks are only as good as the model. If the model is wrong, the Greeks are wrong.
- Margin and forced liquidation risk – Short options positions can generate margin calls in volatile markets. No Greek will warn you that your broker is about to liquidate your position at the worst possible price.
Use the Greeks. But respect their limitations. Never confuse a theoretical sensitivity with a P&L guarantee.
Is There an Edge in Being Long or Short the Greeks?
A common question is whether there’s some sort of edge – or at least persistent risk compensation (like a factor) – to being long or short certain Greeks in a portfolio.
The honest answer: not structurally, but situationally yes. The market is reasonably efficient at pricing the Greeks.
What looks like a “free” premium in one direction is usually compensation for a real risk in the other.
The edge, when it exists, comes from being right about regime, not from being long or short by default.
Long gamma vs. short gamma
Long gamma pays you when realized volatility exceeds implied volatility. You buy options, the stock moves more than the market priced in, you re-hedge profitably.
Short gamma is the opposite: you collect premium when the world is calmer than implied.
Structurally, implied volatility tends to trade modestly above realized volatility on average. This is often called the variance risk premium or volatility risk premium.
That tilts the long-run edge toward short gamma. But the catch is that short gamma loses asymmetrically.
You earn small, steady amounts and occasionally take a catastrophic hit. Position sizing will eat most of the edge for traders who can’t stomach or don’t protect against the tail.
Some traders have personal issues like “don’t be short gamma” or “always be long gamma.” But it’s more for risk management than any explicit edge.
Long vega vs. short vega
Same logic, longer horizon. Selling vega historically pays a premium because someone has to be the natural insurance writer, and insurance writers get compensated.
The edge shows up most clearly in index options, where the variance risk premium is persistent. The nuance is that vega is regime-dependent.
Selling vega into a 12 VIX is very different from selling it into a 35 VIX. The premium is largest when fear is highest, which is also when being short vega is most dangerous.
Buying vega tends to underperform on average, but it’s the right side to be on going into a major market movement.
Long theta vs. short theta
These are mostly mechanical consequences of the gamma and vega decisions above. Long theta (short premium) and short theta (long premium) aren’t independent edges. You can’t farm theta without taking on short gamma and short vega exposure. Alas, theta isn’t a free yield.
Long delta vs. short delta
This is just directional bias. The “edge” is whatever edge you have on the underlying, dressed up in optionality. Equities have historically drifted higher, so long delta has a slight tailwind, but options decay it back out through theta.
Net structural edge = roughly zero.
Rho, lambda, the higher orders
No real persistent edge. Rho matters at duration but is dwarfed by other Greeks for most positions.
Higher-order Greeks (vanna, charm, vomma) describe how hedges decay and not where premium accrues.
The synthesis
The structural edges tend to sit on the short-volatility side: short gamma, short vega, long theta.
They exist because someone has to bear tail risk and the market pays them to do it. The edge is real but conditional on surviving drawdowns that wipe out years of premium in a week.
Most retail traders who “harvest” these edges are systematically underestimating the tail and overestimating their staying power.
The edge is in the structure of the market. Whether you can capture it depends entirely on whether you size small enough to still be trading after the next shock.
Options Greeks Cheat Sheet
Here is the fast-reference version.
| Question | Greek to check first |
|---|---|
| How directional is this trade? | Delta |
| How fast will delta change? | Gamma |
| How much am I paying for time? | Theta |
| What happens if implied volatility rises or falls? | Vega |
| Does the trade care about interest rates? | Rho |
| Will my delta drift over the weekend? | Charm |
| Will my vega change as volatility moves? | Vomma |
| Will my gamma change as time passes? | Color |
| Will my delta change just because volatility moved? | Vanna |
| How much leverage does this trade have? | Lambda |
| Am I exposed to dividend changes? | Epsilon |
Keep this nearby. When a position moves in a way that surprises you, this table points you to the Greek that probably explains it.
FAQs
Are options Greeks accurate?
The Greeks are estimates based on pricing models. Useful for understanding risk. But they’re not exact predictions of option price movement. In real markets, several Greeks move at once and the actual P&L takes into account all of them together.
What are the most important things to know about the Greeks?
If I could narrow down the main lessons:
The Greeks measure sensitivity. They estimate how an option’s price might change if one variable moves – holding the rest constant. Real markets move everything at once.
The most important ones to know first = Delta (price), Gamma (how fast delta moves), Theta (time decay), Vega (volatility), Rho (interest rates)
Buyers and sellers see them flipped. Long options pay theta and own positive gamma and vega. Short options collect theta but carry the risks.
Position matters more than the option. ATM options have the highest gamma, theta, and vega. Deep ITM or OTM options are calmer.
An option can move against you even when you’re right. “IV crush” after earnings is the classic example: stock rises, vega collapses, you lose.
Which Greek is most important?
It depends on the strategy.
- Directional traders = focus on delta and gamma.
- Premium sellers = focus on theta, gamma, and vega.
- Volatility traders = focus on vega, vomma, and skew.
- Long-term position traders = focus on delta and vega, with rho mattering more as duration extends.
Why can an option lose money when the stock moves in the right direction?
Because time decay, implied vol changes, bid-ask spreads, and changing Greeks can offset the benefit from delta.
The most common culprit is IV crush after an earnings event. The stock moves the way you expected. But implied vol collapses; and vega loss exceeds delta gain. You lose money on a correct directional call.
Why does theta increase near expiration?
Time value decays faster as expiration gets closer – especially for at-the-money options. The non-linear decay curve is steepest in the final weeks and days of an option’s life.
Why is gamma highest near the strike?
At-the-money options are where delta can change fastest as the underlying moves.
A small price change can move an ATM option from equally likely to finish ITM or OTM to clearly one or the other.
Think of a tied basketball game between two fairly matched teams.
That shift in probability is what gamma measures.
Is vega always positive?
- Long options have positive vega.
- Short options have negative vega.
A long straddle, for example, has positive vega on both legs. A short straddle has negative vega on both legs.
Why does implied volatility crush hurt long options?
If implied volatility falls after an event, the option’s extrinsic value declines even if the underlying moves favorably.
The vega component of the option price was inflated before the event. After the event, the inflation deflates. That is the so-called crush.
Do Greeks matter for long-term investors?
Yes, especially for LEAPS, covered calls, protective puts, and collar strategies.
Delta, vega, theta, and rho can all matter for longer-dated options.
A LEAPS call is much more sensitive to vega and rho than a one-month call.
Can I trade options without understanding the Greeks?
Technically yes. Profitably over time, that’s where it gets harder.
If you’re pursuing alpha (i.e., market-beating) strategies, then I’d probably say no.
The Greeks are the language of options risk. An options trader who doesn’t understand them is behind the curve.
What is a gamma squeeze?
A gamma squeeze happens when dealers who are short gamma are forced to buy the underlying to hedge.
Their buying pushes the stock higher, which increases their short-gamma position, which forces more buying. It’s a self-reinforcing loop, usually seen in single-stock names with heavy call option interest.
It can even be a direct strategy for those with large positions in the underlying stock to increase its value, and exists in an ethical gray area.
How often do Greeks update?
The Greeks recalculate as the underlying price, implied volatility, time, interest rates, and dividend expectations change. On most platforms, they update in real time with the market.
The rate of change of the Greeks themselves is what the second-order and third-order Greeks measure.
Which Greeks matter for 0DTE options?
Gamma and theta dominate.
Delta changes quickly because gamma is high. Theta decay is compressed into hours. Vega matters less because short-dated options have low vega to begin with.
How much theta decay occurs in an option’s final day?
The percentage depends on how much extrinsic value is left.
For out-of-the-money options, often nearly 100% of remaining extrinsic value disappears by the close, because they expire worthless if they stay OTM.
For at-the-money options, the final day can erase a large share of premium, often 50% to 100% of remaining time value, with the fastest decay usually in the final hours.
For deep-in-the-money options, theta decay is usually smaller percentage-wise because most value is intrinsic, not time value.
Conclusion
The Greeks are a framework for decomposing option price movement into its component sensitivities.
Learn the first-order Greeks deeply.
Understand the second-order Greeks well enough to know when they’re influential.
Know that the third-order Greeks exist and when they might matter. If you’re a sophisticated volatility trader, third-order Greeks will matter to you more than the average trader.
Every option position carries delta risk, gamma risk, theta risk, vega risk, and rho risk simultaneously.
If you open options positions, you have exposure to the Greeks. The question is whether you know which exposures are driving your P&L today, and which will drive it going forward.
Related