An Overview of Comparable Company (Comps) Analysis


Comparable company analysis – also called “trading comps” or “comps” in finance lingo – is another business valuation method to choose from among discounted cash flow and precedent transactions modeling. (A leveraged buyout is also technically a valuation method as well but is more specialized toward private equity firms rather than investment banking.)
It is the most commonly used financial model to value companies in investment banking, in particular.
Comparable company analysis truly isn’t totally different from studying comparable value in any other aspect – whether it be cars or real estate.
When considering the purchase of a car, you will consider factors of car type (compact, sedan, SUV), make/brand (Honda, BMW), fuel economy, and additional features as it relates to the overall price.
For real estate, there is the number of bedrooms, bathrooms, square footage, and location to consider.
What you will typically see is that cars or apartments with similar features about them are priced relatively the same. This goes for car makes of the same tier (e.g., Chevrolet, Ford, Dodge; or BMW, Mercedes-Benz). Compact cars tend to be priced rather similarly while SUVs are priced somewhere north among brands of roughly the same tier.
Similarly, apartments containing 2 bedrooms and 1 bath will tend to be priced similarly in the same part of a city.
However, if we are comparing the 2 bedrooms and 1 bath apartments in Manhattan, New York to those in Chattanooga, Tennessee the prices are bound to be different in accordance with basic supply and demand. This is precisely why, when valuing companies, we would be most prudent to use those from the same industry and of the same relative valuation metrics.
If we fail to control for these factors, our estimates could vary considerably. But naturally, similar companies from the same industry will tend to have similar valuation metrics due to the nature of their business patterns.
How do Comps Differ from Precedent Transactions?
Comps may seem quite similar to precedent transactions given they both involve the calculation of multiples.
However, precedent transactions derives valuation by looking at historical mergers and acquisitions deals while comps uses current valuation metrics as determined by market prices.
For comps to work, the company must have publicly traded securities, such as common stock, preferred stock, convertible bonds, options, and warrants. It also includes income statement and balance sheet items to derive these valuation multiples, such as EV/EBITDA, EV/EBIT, EV/Book value, EV/Sales, and EV/Revenue.
EV, or enterprise value, is a common numerator term that provides an approximate valuation for the firm.
It is equal to:
EV = Equity value – Cash + Debt + Minority interest + Preferred stock
Comps is most typically used when firms are considering a new issue of equity or when a new minority stakes ownership is under consideration.
In these cases, there is no control premium involved (or value accrued from obtaining a majority or full ownership of a company).
This differs from precedent transactions where the calculation of control premium is one of the central attributes of the model.
When there is a change in control of a business, a premium is regularly paid above the market value of the acquisition due to the fact the new majority-control regime now has decision power, unlike a minority owner who has limited say.
The control premium is therefore the value of the business before the transaction occurs versus after it occurs. Hence mergers and acquisitions data must be considered in precedent transactions modeling as opposed to basic current valuation metrics.
This is not relevant in comps modeling given no control premium is relevant when a minority-stakes purchase represents relatively little to no change in an organization’s decision-making/power regime.
How Comps is Performed
For company comparable analysis we are considering the following criteria:
1. Industry and competitors
The industry and competitors of the company help us define/filter our search accordingly. Comparing a mining company with a technology company would be of little use given the very disparate business patterns between the two industries.
Moreover, we often merely wouldn’t look at “technology” companies, but break down further into what that business actually does/sells and who its main competitors are.
Microsoft may be a strong comparable for Apple but not for small-cap semiconductors company due to the difference in size, business model, and industry (though they can both be loosely classified as “technology” companies).
2. Size of the company
The size of the company is often determined by market capitalization, or the company’s stock price multiplied by the number of fully diluted shares (i.e., all forms of stock and convertible securities rather than common stock alone).
3. Valuation multiples
Usually 3-4 multiples are used for each company using last year’s data (most commonly for stable-growth companies) or the forward year’s estimated data and also projected multiples in future years (1-2 years, but up to 5).
4. Any fundamental metrics
Operating metrics such as revenue, growth rates, and profit margins may be used to gain a more thorough fundamental understanding of the company.
5. Summary statistics to render aid in the analysis
All multiples used for each company in the analysis can be summarized at the bottom of a spreadsheet with mean and median determinations.
Mean is usually most appropriate as it derives an average, whereas a median may not be as useful if we merely tabulated data on seven different companies.
The median, of course, could actually be more representative of the same if we have an outlier distorting the average.
Minimum and maximum can also be used to drop out any outliers.
Standard deviation – or some measure of deviation from a central point or tendency – could also be included (though it rarely is) in order to get a feel for the relative degree of dispersion in the data.
A comps spreadsheet will look relatively similar to a precedent transactions table. But instead of mergers and acquisitions data regarding who acquired who, we will look at prior archived valuations of individual companies and make our value readings according to the valuation multiples of those selected companies.
Pros and Cons of Company Comparable Analysis
Like all financial models, none are perfect as there must necessarily be assumptions involved in each. Some models may be great at certain things and weaker at others; appropriate in some situations but injudiciously applied in other circumstances.
Pros
On the positive side of the spectrum, valuation multiples typically denote market efficient values and are thereby likely to represent strong comparables when appropriately filtered by relevant industry, company size, and operating metrics.
Comps is most likely to be accurate when valuation is being undertaken for purposes of analyzing a potential deal involving a minority-stakes ownership rather than an outright acquisition.
This avoids controlling premium from coming into play, which is not a market-efficient phenomena, and requires precedent transactions analysis instead.
Cons
On the negative side, there is the reality that no two companies are a precise match. Even when multiples dovetail well, there should be no assumption that their values are precisely alike.
Moreover, there is the chance that you may not receive any adequate comparables at all. This might be especially true if you are valuing a company in a highly niche industry, such as a diamond mining company.
In such cases, you may not find a sufficient comparable or a representative sample size of comparables to draw meaningful or sound conclusions in any capacity.
Moreover, given that publicly traded securities must come into the picture in comps modeling, if a company’s stock is traded infrequently due to a small number of shares, high price (think Berkshire Hathaway’s A class shares), or other market forces that generally place it into an illiquid trading state, comps might not provide very accurate valuation estimates.
As a result, discounted cash flow analysis should always be used in some form when valuing companies. Each form of analysis complements and helps inform the other to cross-check for accuracy.
Available Templates
One of the best ways to learn financial modeling is naturally to actively do it as opposed to merely reading about it or absorbing information passively.
However, if you can do the various forms of discounted cash flow, precedent transactions, leveraged buyouts, and accretion/dilution, you will find company comparable analysis to be the easiest.
There is relatively little to it, although it may contain a degree of tedium – filling in values regarding the income statement, balance sheet, data that feeds directly into enterprise value, and information on the various forms of securities that are publicly traded (some forms may not exist for a company).
One template available is the one created by Dheeraj Vaidya, a blank workbook that calculates the multiples EV/Revenue, EV/EBITDA, and EV/EBIT.
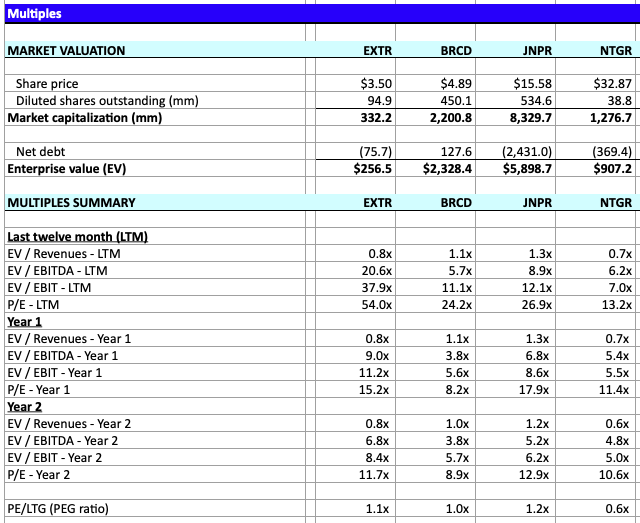
There is also a comps spreadsheet available on Macabacus, which provides hypothetical company data to provide EV/Revenue, EV/EBITDA, P/E, and PEG ratio. PEG is used occasionally as a multiple, and measures P/E to growth rate (i.e., (stock price / EPS) / growth rate).
A fairly priced stock will usually have a PEG of approximately 1. An overvalued company will have a PEG greater than 1; undervalued, less than 1.
One of the best that’s currently available is the one by Wall Street Prep due to its level of organization that surpasses the other two. It proceeds in a logical vertical format from market data inputs, shares data, income statement items from the last quarter, last fiscal year, last twelve months (LTM), future projections of one year, two years, and five years, balance sheet data, and multiples calculation.
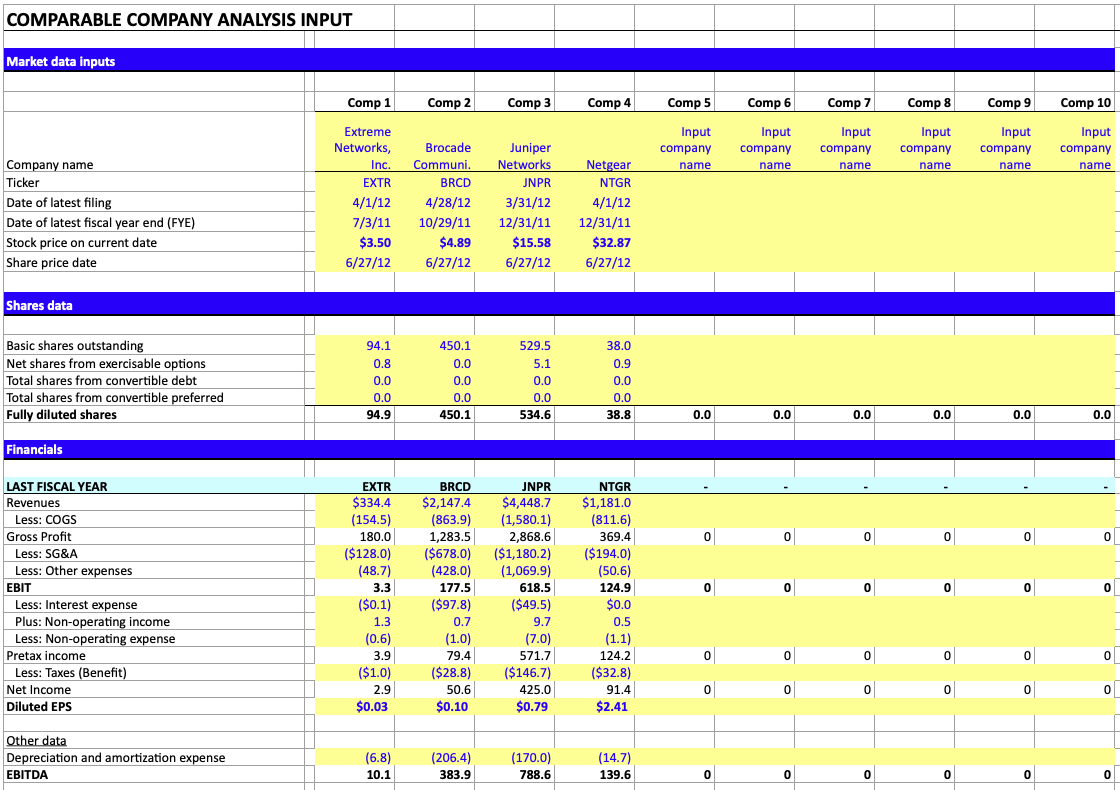
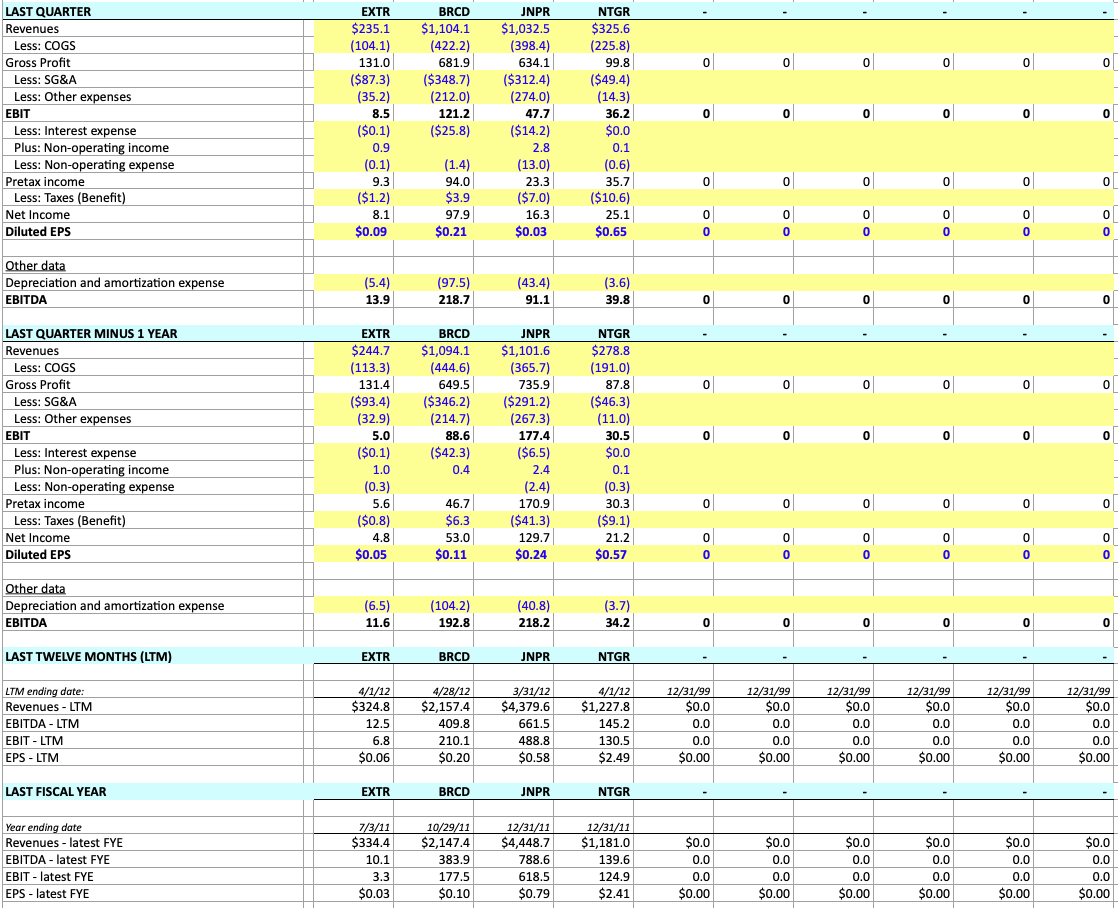
The multiples of various companies will often appear at the bottom or in their own section of these spreadsheets.
We would recommend to begin with this model and proceed to the other two should you desire to see alternative examples of how comps models are pieced together.
Conclusion
Company comparable analysis is the most common and widespread model seen in investment banking and is a core method of company valuation. Comps follows a process of selecting a coverage universe that includes companies similar in size, industry, and operating metrics.
When the financial information of each comparable company is found, key statistics and ratios must be calculated to form multiples in order to value the company of interest.
While comps is the most popular category of modeling in investment banking due to its ability to estimate company value in a straightforward manner, it is often not ideal. No two companies are a precise match and may give erroneous readings.
This is an even bigger issue if a company’s publicly traded securities are not entirely liquid.
Moreover, they are only appropriate when the valuation is being assessed for purposes of a party looking to acquire a non-controlling share of the company given the lack of control premium involved.
For prospective majority stakes deals (mergers and acquisitions), we must look toward precedent transactions modeling.
With this being the case, comps should regularly be used in conjunction with discounted cash flow valuations as well to provide a broader and more accurate overall picture of a company’s value.