How to Choose the Appropriate Model for Business Valuation


We’ve covered valuation models from discounted cash flow to options pricing, to 1-/2-/3-stage growth models, and with respect to free cash flow to the firm (FCFF), free cash flow to equity (FCFE), dividend discount (DDM), economic value added (EVA), over a host of different scenarios.
But how do we know which business valuation model is most appropriate to apply given a set of circumstances?
The appropriate model will primarily depend on the firm’s level of earnings, financial leverage, dividend policy, and free cash flow inputs.
In this case, we use a handy Damodaran model (i.e., ‘model.xls’) to run through this exercise.
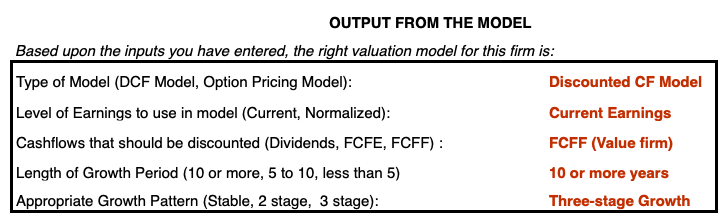
In the end, the model recommendation will be comprised of five components:
- Type of model (option pricing, discounted cash flow)
- Level of earnings (normalized, current)
- Type of cash flow discounted (dividend, FCFF, FCFE)
- Length of growth period (<5, 5-10, >10)
- Growth pattern (stable (one-stage), two-stage, three-stage)
Type of model
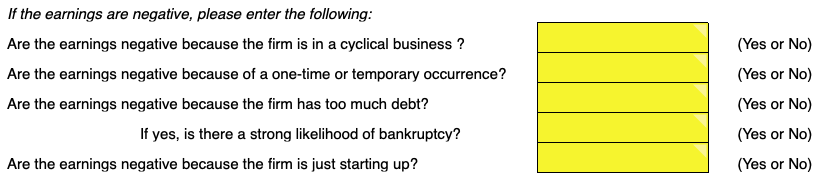
An option pricing model is most relevant for distressed firms with negative earnings.
This will be a clear minority of cases, as most firms have positive earnings and will not be at risk of bankruptcy. Even when an option pricing model is best suited to the task, a discounted cash flow model will be completed first regardless.
The Black-Scholes model can be used for firms that are difficult to value via conventional means or when alternative models may not reflect the risks inherent in a negative earnings firm facing possible insolvency.
They are questions on the spreadsheet in the event of instances of negative earnings:
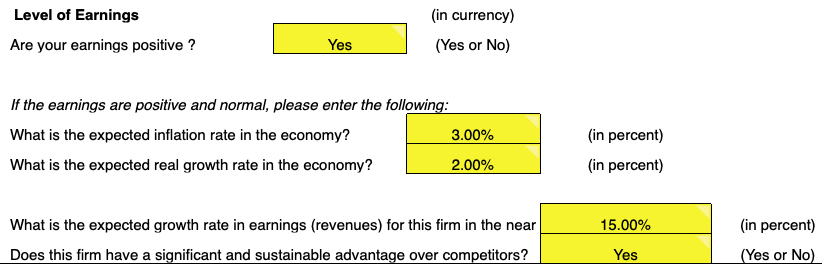
Level of earnings
Earnings are the net monetary amount derived from a corporation’s operation. The are two basic forms of earnings – normalized and current.
Normalized earnings are those that have been adjusted to compensate for the up and down, cyclical nature of the economy. Or they may refer to earnings that divest of unusual, temporary, or singular impacts seen on the company’s balance sheet.
Current earnings are simply the after-tax net income amount. In most cases, current earnings will be used unless the business follows a highly cyclical pattern or encounters fleeting or one-time impacts on its balance sheet.
Type of cash flow discounted
The dividend discount model is rarely used in the real world.
The model is very sensitive to the growth rate employed and can cause distortion the closer it approximates the cost of equity discount rate.
And of course the dividend discount model would be unviable completely if a company does not issue discounts in the first place.
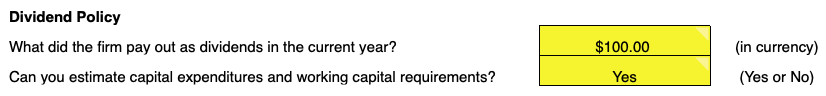
Dividend policy is an aspect of the spreadsheet, where annual dividends paid out can be entered, in addition to the cash flow related information on capital expenditures and working capital.
Traditionally, it’s between FCFF and FCFE. If a company’s capital structure is more stable, then FCFE is more of a direct method to completing a DCF analysis.
FCFF, however, is more likely to be used in instances of a leveraged company with a negative FCFE.
That is, a firm with a high debt-to-equity ratio that produces negative cash flows under the free cash flow to equity framework.
Equity value could still be obtained in the FCFF approach by finding the present value of operating assets and deducting the market value of debt to derive equity that way.
FCFE can be negative in circumstances where there is a large negative net income or when capital expenditures surpass the net income figure.
FCFF may be more suitable in cases of a leveraged firm with a changing capital structure.
The cost of equity – the discount rate in the FCFE model – might be more sensitive to changes in debt (the central component in figuring financial leverage) than would be the cost of capital.
Or more specifically the weighted average cost of capital, WACC, that serves as the discount rate in the FCFF discounted cash flow framework.
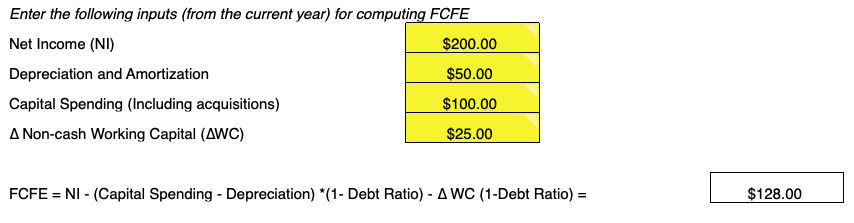
An FCFE calculation is done toward the bottom of the spreadsheet to evaluate free cash flow according to the following formula:
FCFE = Net income – (Capex – Depreciation) * (1 – DR) – ∆Working capital * (1 – DR)
DR signifies debt ratio.
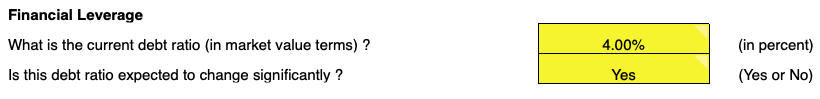
The debt ratio is the total amount of debt divided by total assets.
The higher the debt ratio, the more leveraged the firm and the higher the financial risk.
Length of the growth period and growth pattern
This is contingent on our earnings growth rate estimation for the upcoming period relative to the inflation rate and real growth rate of the economy.
If we assume 2% inflation in the economy and a real growth rate of 2% (4% nominal rate), then anything below 6% might be considered a company in a “stable” growth period as the dispersion likely wouldn’t be that far from the mean of the 4% nominal rate.
For a firm with a 6%-10% growth rate, the estimated high growth period would be expected to run for between 5-10 years and would be best suited to a two-stage DCF model.
A two-stage model involves a firm scaling down in growth rate until it hits the expected or industry average growth rate.
After this point, a terminal growth rate can be calculated to determine the total cash flows to be discounted by a particular rate to determine their present value.
For a growth rate above 10% at these particular inflation and real growth rates, this would be considered a “high growth” company and it would be most appropriate to use a three-stage model.
In the three stage, we have cash flows accumulating in three phases:
a) during the length of the high growth period,
b) during the transition phase where the firm growth rate slows down to economy or industry average as it loses its competitive edge, and
c) during the stable growth phase.
For the calculation of what constitutes a “high growth period” (three-stage DCF) it’s subject to cutoffs that are determined by the analyst’s discretion.
In the spreadsheet, a period is considered high growth if its growth rate is greater than the sum of the inflation rate, real growth rate of the economy, and an additional 6%.
So for a 2% inflation/2% real growth rate economy (which is fairly typical in developed markets), that would be any firm experiencing a greater than 10% current growth rate.
A “moderate growth period” (two-stage DCF), it could be defined as a range between inflation rate plus real growth rate plus an additional 2%-6%.
This would come to 6%-10% for a 2% inflation/2% real growth rate economy.
A “stable growth period” would then be anything under what’s defined as inflation rate plus real growth rate plus 2%.
Or anything under 6% for a 2%/2% economy.
These are somewhat arbitrary but realistic approximations.
It is all predicated on their growth relative to the economy and the rate at which their competitors grow.
Mature firms will generally be stable, one-stage DCF candidates (assuming their earnings are not negative).
Moderate growth firms will best be suited to two-stage models.
And the highest performers maintaining a competitive edge in their industry will best be valued using three-stage DCF models.
This advantage can be rooted in natural monopoly, brand name value, economies of scale (cost savings via increased output), and/or technological superiority over its competitors.
Conclusion
When it comes to business valuation models using information directly off a company’s financial statements, you are mainly limited to two types of overarching frameworks:
- options pricing and
- discounted cash flow models
Earnings types are relegated to current earnings (standard) and normalized earnings that deal with companies whose business is afflicted by the cyclical boom and bust cycle of the economy or temporary impacts on their balance sheets.
The type of discounted cash flow model used is largely contingent on the firm’s dividend policy, the value of other cash flow readings, and the capital structure of the company.
And lastly, the discounted cash flow models have various stages built in to reflect how the firm in consideration grows relative to the overall economy.
Stable growth firms have just one stage given they can be expected to grow at that rate in perpetuity.
Two-stage models reflect companies undergoing moderate growth transitioning into a stable growth phase.
Three-stage models are best suited to companies currently undergoing a high growth period for a period of years before transitioning into a stable growth phase that, in theory, lasts the lifetime of the company.