Business Cycle Analysis: No One-Size-Fits-All Approach


Business cycle analysis often involves an aggregation of past experiences and then tying together the cause-effect relationships that drove those cycles.
Traders are especially interested in business cycle analysis given how it drives trends in asset classes, sectors, and investment outcomes.
For example, early-cycle tends to be favorable to cyclical stocks while late-cycle favors being defensive, and the actual down-cycle favors being short (or flat) equities and long fixed income and other safe assets.
Economic cycles occur as a series of events that recur in patterns for perfectly logical reasons. However, history is not destiny and these cycles are not going to repeat in exactly the same way nor will they take the same amount of time. They are all different in some ways.
In a market-based economy, expansions and contractions will occur essentially any time money is borrowed.
Buying something on credit means not only borrowing from a lender, but also borrowing from yourself in the future.
In other words, you are creating a time in the future where you will need to spend less than you make in order to pay back that liability.
This pattern of borrowing, spending more than you earn, and having to spend less than you earn will very rapidly begin to resemble a cycle with upswings above the baselines (i.e., productivity gains) and downswings below it.
This is just as true for a national sovereign economy as it is for a company as it is for an individual or household.
Borrowing will set a predictable and mechanical series of events into motion.
Post-recession forecasting
In the post-recession phase, forecasting often involves applying past recessions to inform the current one.
For example, when traders open their “post-recession playbook” they’ll often say something like “sector X has outperformed in the early stage of the expansion in 5 out of the past 7 recoveries.”
In the early part of the cycle, some traders want to hold cyclical companies – like durable goods manufacturers, airlines, consumer cyclical, and others that do well in the early stages.
This is typically used to help inform tactical decisions. But they also require caution because each cycle and situation is unique.
Typically, a downturn works through credit. First, there’s a tightening in monetary policy via a rise in interest rates. This is normally done to rein in inflation.
This causes debt servicing obligations to rise in excess of incomes, new credit availability, and money and other liquid assets available to pay it.
In these cases, credit is hit first and income gets hit later. You can see this in statistics like the unemployment rate
The unemployment rate is a proxy for the amount of spending in an economy.
We actually generally see unemployment peak very early in the next expansion and not during the recession itself. Labor is normally a lagging indicator.
This can be observed in the graph below.
Unemployment rate, U-3 (US)
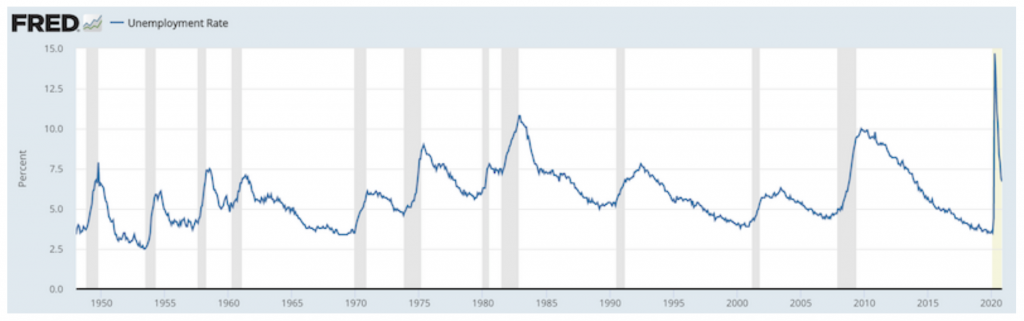
(Source: U.S. Bureau of Labor Statistics)
The 1990-91 recession came as a result of excesses in the commercial real estate sector and high yield debt. The 2000-02 recession came as a result of too much money chasing tech. The 2007-09 sector came in subprime residential real estate.
Some recessions can come from a rise in oil prices and seeing higher consumer prices as a direct result. The central bank wants to control excess inflation by tightening credit.
No tightening cycle ever works perfectly. The trade-offs between output and inflation generally become more acute the later you get in the cycle and balancing the two becomes more difficult as time goes on.
When the central bank inevitably overtightened, the economy would turn down due to debt obligations in excess of income, new credit, and liquid assets available to service it.
The downturn would normally be arrested by cutting rates to get the positive spread between nominal growth and nominal interest rates back, so the economy could grow again on aggregate.
(Averages nonetheless obscure important details about individual households and companies, so not everyone would be saved.)
Business Cycle Analysis: Credit costs vs. Growth Rates
A basic model of credit costs versus nominal growth rates can explain much of business cycle analysis even if it’s oversimplified.
You normally see credit costs excess nominal growth rates at the tail end of expansions and a recession follows afterward.
The graph below shows a simple model of nominal GDP growth in year-over-year terms (red line) versus credit costs (blue line).
Credit costs often run in excess of nominal growth in the late stage as the Fed tries to fight inflation, producing a downturn that is then rectified by cutting rates.
Fed Funds Rate vs. Nominal GDP Growth (US)
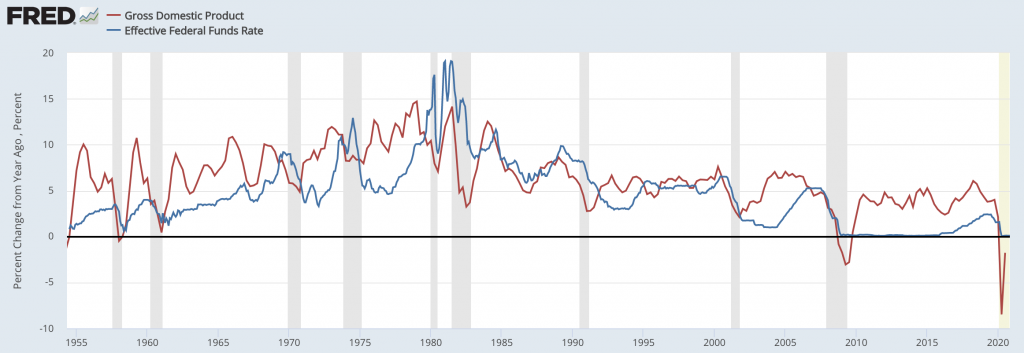
(Sources: BEA, Board of Governors)
Financial imbalances vs. Drop in incomes
Of course, the 2020 pullback had nothing to do with financial system imbalances by itself. The high asset prices and high debt going in made it worse, but the tightening in credit didn’t trigger it.
It was a health crisis, where people sheltered inside and many stopped working and spending to a large degree to distance from other people.
This brought many parts of the economy to a sudden and near-complete stop.
This is very unusual, which in turn brings about major differences compared to how business cycle analysis would inform you of how to trade and invest.
Generally, when there’s an economic downturn, the issue becomes highly political and social tensions flare up. In normal debt crises, people get angry at the debtors and financial institutions that helped bring about the debt problems.
As a result, they don’t want the government to bail them out. After all, “the government” itself is essentially their tax money.
Policymakers also don’t want to incentivize this behavior going forward so they generally want borrowers and creditors to have to suffer the consequences of their decisions.
Otherwise, this “moral hazard” dilemma can become a major concern.
You see such arguments today when it comes to matters like the student loan issue. People pursued degrees that didn’t give them the marketable skills that are rewarded in the economy. Accordingly, many aren’t getting the ROI on that education.
So, at first, policymakers typically don’t want to provide government supports.
At the same time, not providing support causes the debt crunch and economic contraction to get worse. The longer the economic contraction phase goes on the costs of not providing support increase in excess of the costs to doing so. Moreover, it unfairly disadvantages too many people who see their jobs and income get taken away.
Eventually, assuming policymakers have the privilege of having a reserve currency (a currency that is used and saved in broadly throughout the world), they choose to create money, monetize debt, and provide lender-of-last-resort related backstops. This gets the economy going again into a positive growth trend.
If they do these things well, the depression is more likely to be short-lived.
The depression of the early 1930s was long and severe due to the holdout of necessary supports.
Policymakers also didn’t initially have a good understanding of the type of problem they were facing because the credit crunch at the end of the 1920s was so different from the previous recessions that had happened in their lifetimes – e.g., 1893, 1901, 1907, 1920.
The 2008 decline was shorter and the contraction less severe, as they had the Great Depression to learn from, which was analogous. Although they still moved too slow, Bernanke’s academic work had largely been on the Great Depression.
The 2020 decline was sharper at first. But it took less time to correct as the central bank had very recently been in that position in 2008 and were as aggressive as they needed to be to get a bottom in the financial economy in March (and bottom in the real economy in May).
They created money at the rate of about 100 percent of GDP to get the bottom a little after a month past the top in the stock market.
Moreover, viruses are not a moral hazard issue. There was really no one to blame for any financial excesses preceding it, as is the case in many debt crises.
Central banking and policymaking more generally is largely about altering incentives. Providing the support was not believed to encourage bad behavior.
Failure to act quickly and sufficiently will mean a prolonged depression phase is likely, such as the Great Depression in most of the developed world in the 1930s and Japan in the 1990s following the popping of its asset bubble in 1989.
In fact, the stimulus in 2020 was so big that the household disposable income increased as the fiscal transfers outweighed the aggregate losses in pay. That’s unusual for a year where a recession occurred.
Goods vs. Services
The composition of the recession and ensuing recovery has also been different.
During recessions, service providers typically hold up better than goods producers. This is because manufacturers are often stuck with surplus inventories they aren’t able to sell and get revenue for.
Final Thoughts
The financial news will be full of recommendations of what to invest in based on what did well in past recessions and recoveries.
When considering these arguments, it’s best to understand how recessions and business cycles are different from each other and whether the “early-, mid-, or late-cycle playbook” is relevant.
Tech is a cyclical industry, but it may be considered less cyclical this time around and more of a store of wealth as it produces the technologies likely to generate the big productivity gains going forward.
Macro markets will continue to have plenty of opportunities with the divergences seen across sectors, asset classes, and countries, but they will be as unique as the recession that preceded them.