What Are Market Bubbles? [And How to Identify Them]

We’re in a zero interest rate world, which is the most important theme currently governing financial markets and has big implications for portfolio construction.
By extension, this means we’re in a period where the forward returns of financial assets will be low across the board. While this support is necessary, it makes markets susceptible to bubbles.
In the developed world, cash rates are zero practically everywhere you go. In some places (e.g., EU, Japan), they’re negative. In the US, some parts of the curve briefly went negative, anticipating that the US could be forced to go this route as well.
Bonds of longer duration are also at or around zero as well.
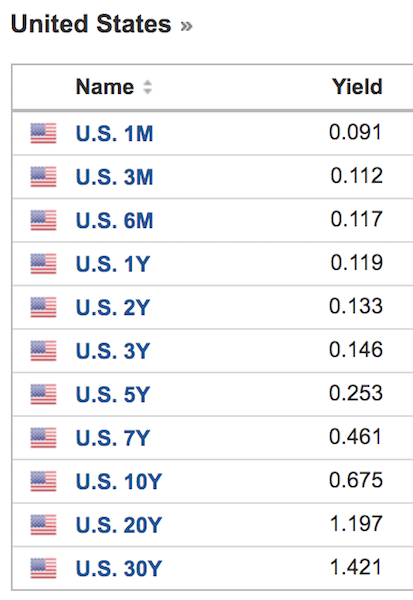
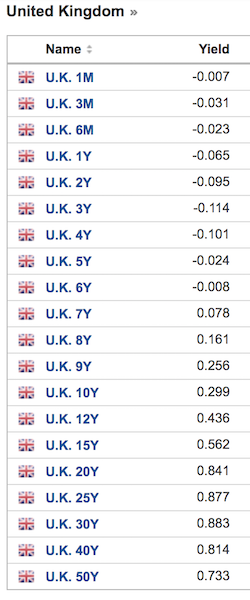
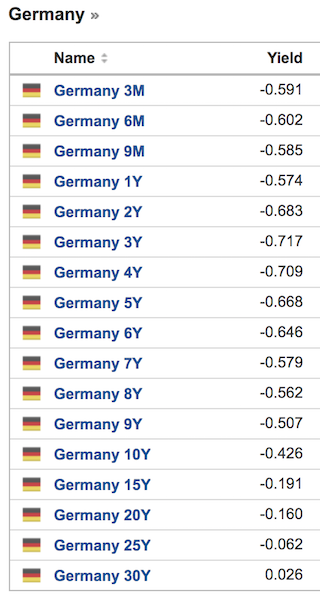
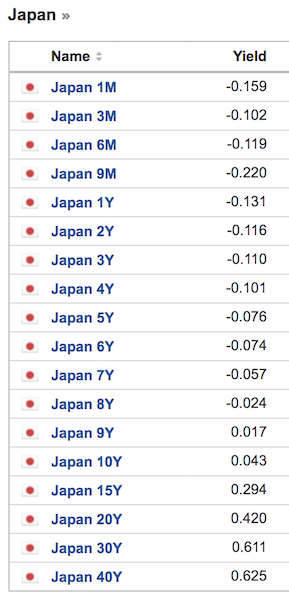
(Source: investing.com)
The “yield” on stocks is more difficult to determine because they don’t come with advertised rates like cash and bonds do.
Stocks convey ownership of a business that represents a residual value after everyone else has been paid. They’re perpetual cash flow instruments, so their structural volatility is higher.
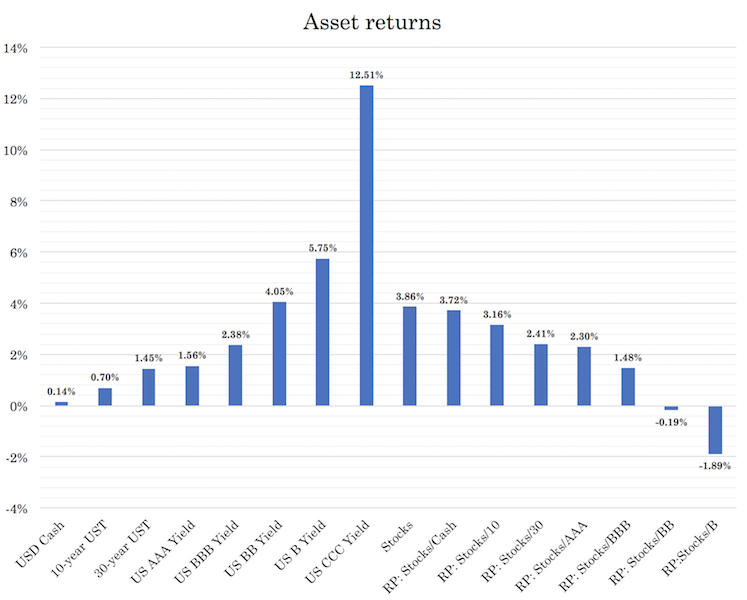
What we do know is that stocks historically, over the past 50 years or so, have had an extra 2 to 3 percent annual return over 10-year Treasury bonds.
So, if mid-duration “safe assets” yield 50bps or less, there’s very little to no discount rate. The value of a business is simply the amount of cash you can earn from it over its life discounted back to the present.
Accordingly, if there’s no discount rate – i.e., the rate off which the present value of future cash flows can be calculated to get its fundamental value – then you’re just left with the risk premium (traditionally that 2-3 percent).
The inverse of that 2-3 percent represents the price-earnings ratio, or about 33x to 50x (1 divided by .03 and 1 divided by .02, respectively).
That means traditional markers of value, like the 10x to 20x P/E ratios that investors have become used to are extrapolations of a previous environment in which yields were much higher.
For example, in an environment where the cash yield is 5 percent, mid-duration safe bonds give you 7 percent, stocks would typically yield around 10 percent (10x P/E), keeping in line with the typical risk premiums.
Portfolio assets’ performance: January 1972 to present
| Name | CAGR | Stdev | Best Year | Worst Year | Max. Drawdown | Sharpe Ratio | ||
|---|---|---|---|---|---|---|---|---|
| US Stock Market | 10.67% | 15.63% | 37.82% | -37.04% | -50.89% | 0.44 | ||
| 10-year Treasury | 7.05% | 8.02% | 39.57% | -10.17% | -15.76% | 0.32 | ||
| Cash | 4.65% | 1.01% | 15.29% | 0.01% | 0.00% | N/A | ||
| Gold | 7.62% | 20.02% | 126.55% | -32.60% | -61.78% | 0.24 |
If cash and bonds are now at zero yields, and stocks keep that same 3.0-3.5 percent premium, your P/E is now 3x to 4x higher.
That means what formerly might have been a $10 billion market cap company is now a $30-$40 billion market cap off the same earnings.
All assets compete with each other, and once other assets get bid up, others look more attractive in relative terms even if the risk in absolute terms remains the same.
Even if the forward returns on stocks are about 3 percent in developed markets going forward instead of the 5-12 percent in recent history going back decades, the risk is still the same.
And there are also other issues to worry about, such as geopolitical conflict and the dollar’s reserve status.
And while asset returns could still be okay in nominal terms, that doesn’t necessarily mean they’ll be good in real terms. And they’re quite unlikely to be due to low productivity growth and aging populations.
When the returns of riskier or higher duration assets get down to close to zero, then it increasingly no longer makes sense to own them.
For example, if the 10-year yield is 100bps, and your upside is the yield going down to minus-100bps and your downside is a normalization in real rates plus an inflation rate of 4 percent, your risk is about 3x your potential reward.
So, cash doesn’t return anything. It is safe in the sense that its value doesn’t change much.
But it’s the worst thing over the long-run due to inflation and any taxes on the yield.
Then bonds don’t yield much or anything at all (and negatively in real terms), plus have price movement providing mark-to-market risk.
That gets more capital into stocks, bending those yields down to cash and bond rates and inflating their multiples on earnings.
Here are forward nominal return estimations for US assets (early-2021 estimates). The figures on the right show risk premiums (“RP”) between different asset classes.
But let’s back up a bit first and describe the bubble phase, the warning signs of a bubble, and the lead-up to a bubble.
Developed market bubble vs. Emerging market bubbles
Emerging Markets
We published a series on trading the cycle in emerging markets.
The types of recessions we see in emerging markets are different from those in developed markets.
Broadly speaking, developed markets are countries with:
- reserve currencies
- stable political environments
- developed capital markets (debt and equity)
- strong rule of law
- respect for private property rights, among other markers.
Emerging market recessions tend to be inflationary while developed market ones tend to be deflationary.
This is because of the effect of the currency dynamic.
Emerging markets tend to borrow in other countries’ currencies. When a recession hits and the currency declines relative to the one they borrow in, that’s like a big surge in interest rates.
Printing money to make up for the shortfall worsens the depreciation, which increases the costs of imports and typically leads to a contraction in supply relative to demand, pushing up the prices of goods and services (i.e., inflation).
Developed Markets
On the other hand, in developed markets, recessions tend to be deflationary.
They heavily borrow in their own currencies, so they avoid the FX risk. When a downturn occurs, debt servicing exceeds income. Spending must be cut back, which is deflationary.
Countries that can “print” money will try to do so to offset the drop in credit.
Countries that can’t print money, or can only do so to an insufficient extent because they lack reserve currencies, will need to restructure their debts.
The bull market
In the early part of the cycle, incomes are growing faster than debt. Debt growth is robust, but still lower than income.
In the early stages of bull markets, there is a wide range of productive investments. So even though debt growth is strong, it’s used productively to produce income in excess of the debt.
If money is borrowed and it makes a business more productive by providing goods and services that provide value and grow revenue commensurate with such value, then debt burdens will remain low and balance sheets will remain healthy.
Given such an environment with quality forward returns, there is enough room for the private sector, financial system, and government to lever up.
When inflation is a reasonably low and stable percentage and debt growth is below or in line with income growth, this is a quality period for investments and justifiably produces a bull market.
The bubble phase
The bubble phase begins when debt growth is faster than income growth.
This is when debt produces income less than the sum of principal and interest payments. The debt growth becomes unproductive.
Yet rising debt growth still produces strong returns in assets, income, and overall economic growth. The price of financial assets is a function of money and credit spent divided by their quantity.
Even if the debt being produced doesn’t throw off the cash flow to make these debts viable, there’s a tendency to extrapolate the past and assume it’ll be like the future even when the underlying conditions change.
Higher debt produces rising net worths, incomes, and asset values. This perpetuates the process as borrowers become more creditworthy.
Creditworthiness is a function of:
i) income and projected cash flow available (or likely to be available) to service the debt
ii) existing savings and net worth or available collateral
iii) their own capacity to lend capital (i.e., for banks, fintech, non-bank lenders, hedge funds, etc.)
All of these factors rise in tandem.
Borrowers will feel wealthier even when the underlying state of conditions changes from the “healthy bull market” phase to the “bubble” phase.
Debt growth is exceeding income growth yet they continue to buy assets at high prices on credit.
For example, assume someone makes $100k per year and has a net worth of $100k.
Let’s say they could borrow up to $10k per year, which means they could spend $110k per year for several years even though their annual income is only $100k.
This increased capacity for borrowing allows for higher spending and a person’s spending can lead to higher income, higher asset valuations, and/or higher savings. This, in turn, gives them even more collateral to borrow against.
This causes people to borrow more and more, with this process quickly starting to resemble a cycle. When people borrow, they are not only borrowing from a lender, they are borrowing from their future self.
Eventually they have to spend less, invest less, and/or take less for themselves because they have to pay that money back.
But so long as that borrowing helps drive economic growth and it produces more income in excess of the servicing, it’s affordable.
In the upswing in the debt cycle, the promises to deliver money (namely, debt burdens) rise relative to the money supply, economic growth, and all forms of liquidity available to borrowers to pay back their obligations (which come from incomes, new borrowing, and asset sales).
Over the years, central banks periodically adjust short-term interest rates to slow down or help pick up the rate of credit creation. This is the standard business cycle that most of us are used to and experience multiple times over the course of our lifetimes.
Many business cycles add up to a longer term debt cycle that ends when short-term interest rates hit zero.
Since the early 1980s in the developed world, interest rates have been in secular decline. Central banks have managed several business cycles during this period.
But each cyclical peak and cyclical trough has been lower than the past.
Short-term interest rates: US, Japan, UK
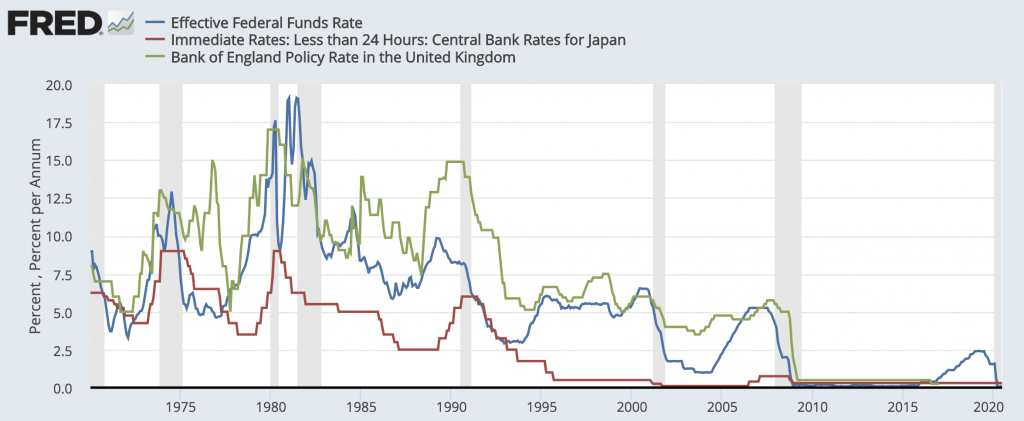
(Source: St. Louis Federal Reserve)
Lowering interest rates increases the demand for debt and it also raises asset prices and people’s wealth (through the present value effect in terms of what lowering interest rates does to increase asset prices).
Generally, this creates progressively higher debt levels relative to income and reduces the capacity to raise interest rates without triggering an intolerable drawdown in the economy.
Eventually, short-term interest rates hit zero and the capacity to push credit creation further can’t go on.
While the business cycle that we’re used to ends whenever the central bank hikes interest too far (usually to rein in inflation), the longer term debt cycle ends when rates hit zero or a bit below zero and can’t be pushed down further.
The hitting of the zero lower bound usually occurs when:
i) debts become too large relative to the amounts that can be borrowed, and
ii) the debts become too large in relation to the money in existence
When the amount of money and credit coming in can’t rise relative to the need to service debt, the process works in reverse.
Investors need to deleverage, borrowers default, creditors pull back lending, and the down part of the cycle beings.
Borrowing is a way of pulling forward spending. The person who spent $110k per year and was earning $100k per year now has to spend $90k per year for as many years as he spent $110k per year, holding all else equal.
This is the general dynamic that inflates and deflates a bubble.
How Bubbles Start
Bubbles typically begin as excessive extrapolations of justified bull markets.
Bull markets are justified when interest rates (i.e., cash rates) are low relative to the returns on stocks, credit, real estate, and other equity investments.
When they go up, economic conditions improve as people become wealthier, companies hire more, corporate profits increase, which improves their balance sheets and ability to take on more debt. All of these influences cause companies to be worth more.
When asset prices go up, spending and incomes rise, as do net worths.
Business people, investors, banks and other financial intermediaries, and policymakers have more confidence in ongoing prosperity. This causes leverage in the system to increase.
The boom also encourages new speculative flows from new investors who fear missing out on the gains. This fuels the bubble further.
Anywhere from “sometimes” to “frequently”, governments adopt policies that encourage banks and other financial intermediaries to lend to those who are unlikely to represent profitable lending opportunities.
This encourages reckless lending and a buildup of bad debt within the system.
Credit standards being lowered are one of the hallmarks of a justifiable bull market turning into a bubble.
With new lenders and new speculators in the market, new types of unregulated investment vehicles develop. Non-bank lenders are collectively called the “shadow banking” system, which are also not subject to the same government protections.
New lending vehicles are commonly created (e.g., peer to peer lending) and financial engineering occurs to generate higher prospective returns.
Lenders and speculators typically make a lot of money quickly.
This helps reinforce the bubble as higher net worths helps secure new or larger loans to buy even more assets.
While this is going on, most don’t believe it’s a problem.
People like it because they’re getting richer or, from the outside, view it as a positive. Most assume it’s a productivity-driven boom. In turn, this causes the rise to feed off itself.
With stocks and other risk assets, rising prices leads to more investment and spending. This raises earnings, which in turn increases asset prices further.
This narrows credit spreads and incentivizes more lending due to higher earnings and more valuable collateral, which increasing investment and spending, in a self-perpetuating cycle.
Most people think the assets they’re buying are great to own and anyone who doesn’t is missing out.
So, all sorts of entities (institutions, retail, banks, etc.) build up long exposure to these assets.
Asset-liability mismatches increase in various forms:
i) increasing liquid liabilities to invest in illiquid assets
ii) borrowing short-term securities to invest in more volatile, longer duration assets
iii) carry trade exposure increases, such as borrowing in one currency to buy another that yields more
iv) borrowing money from other people to invest in risky forms of debt and equity
All fundamentally rely on chasing some type of spread between prospective returns and the borrowing rate.
However, as asset prices are bid up, this narrows the spread. Typically, capital market participants will increase their leverage to achieve the desired return on equity, building further leverage into the system.
Debts rise and debt servicing costs typically increase even faster.
On top of all this, while the central bank is mostly concerned about inflation in goods and services, the inflation in financial assets is actually more insidious.
While goods and services inflation is viewed as a bad thing because it increases the cost of living and creates lower disposable income at a certain point, financial asset inflation appears like a good thing and it isn’t prevented.
However, it’s just as bad as any other form of indebtedness.
A financial asset represents a securitization of a cash flow. In order for the asset to justify its valuation, it has to earn that income to give you the earnings or cash flow you’re entitled to.
But if booms are an effect of debt rather than productivity and not enough income is produced from this debt, asset prices become out of whack relative to the practical level of earnings they can generate.
Moreover, financial booms financed by debt typically come alongside periods of low inflation (often because low interest rates go hand in hand with low inflation, which incentive borrowing), even though they appear to be driven by productivity gains.
This was true in much of the developed world in the 1920s leading up to the 1929 bust, Japan in the late 1980s, and most of the world in the mid-2000s leading to the 2007-09 financial crisis.
The overweighting and extrapolation of recent history
Markets are discounting mechanisms where they price in a weighted average of all opinions called a consensus.
This is generally considered a reasonable picture of what’s likely to happen even though the future is typically different from the past.
Humans tend to follow the crowd and emphasize recent experiences.
For example, asset prices going up often makes them seem like better investments rather than worse investments.
Though if we follow common behavioral patterns when it comes to a consumer good, a rising price typically makes us less likely to purchase it, not more likely.
Because the consensus is always priced in based on the capital flows that created those prices, inappropriate extrapolations of the past tend to occur.
At these periods, debts relative to income tend to rise very rapidly.
Bubbles are likely to occur near the top in the various cycles, whether this is the business cycle, longer-term debt cycle (i.e., when interest rates hit zero), and/or the balance of payments cycle (more common for emerging markets).
When the bubble nears its top, there are the conflicting elements of the economy being the most vulnerable at the same time people feel the wealthiest and most bullish.
Debt to income ratios commonly average around 300 percent of GDP at the peak and is generally accompanied by a flattening yield curve (i.e., long-term interest rates coming down to short-term interest rates).
Monetary policy’s role
Oftentimes, monetary policy helps inflate the bubble rather than reel it in.
This is particularly true when inflation is modest and within acceptable limits, growth is at around expectations, and the returns on investment assets are solid.
This helps reinforce the optimism driving investors to buy financial assets on leverage.
Because central banks have statutory mandates to focus on limited frameworks (inflation or inflation and growth), and not credit growth, they often don’t adequately tighten policy. This was responsible for Japan’s market dynamics in the late 1980s.
Looking at averages also tends to skew important variations around those averages within key parts of the economy.
Nikkei 225 Chart, 1984 to the present
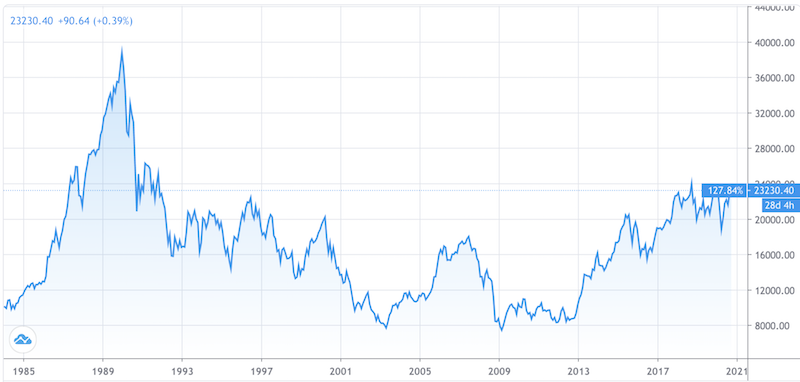
(Source: Trading View)
It was also true for housing in the mid-2000s.
US residential housing vs. US nominal GDP
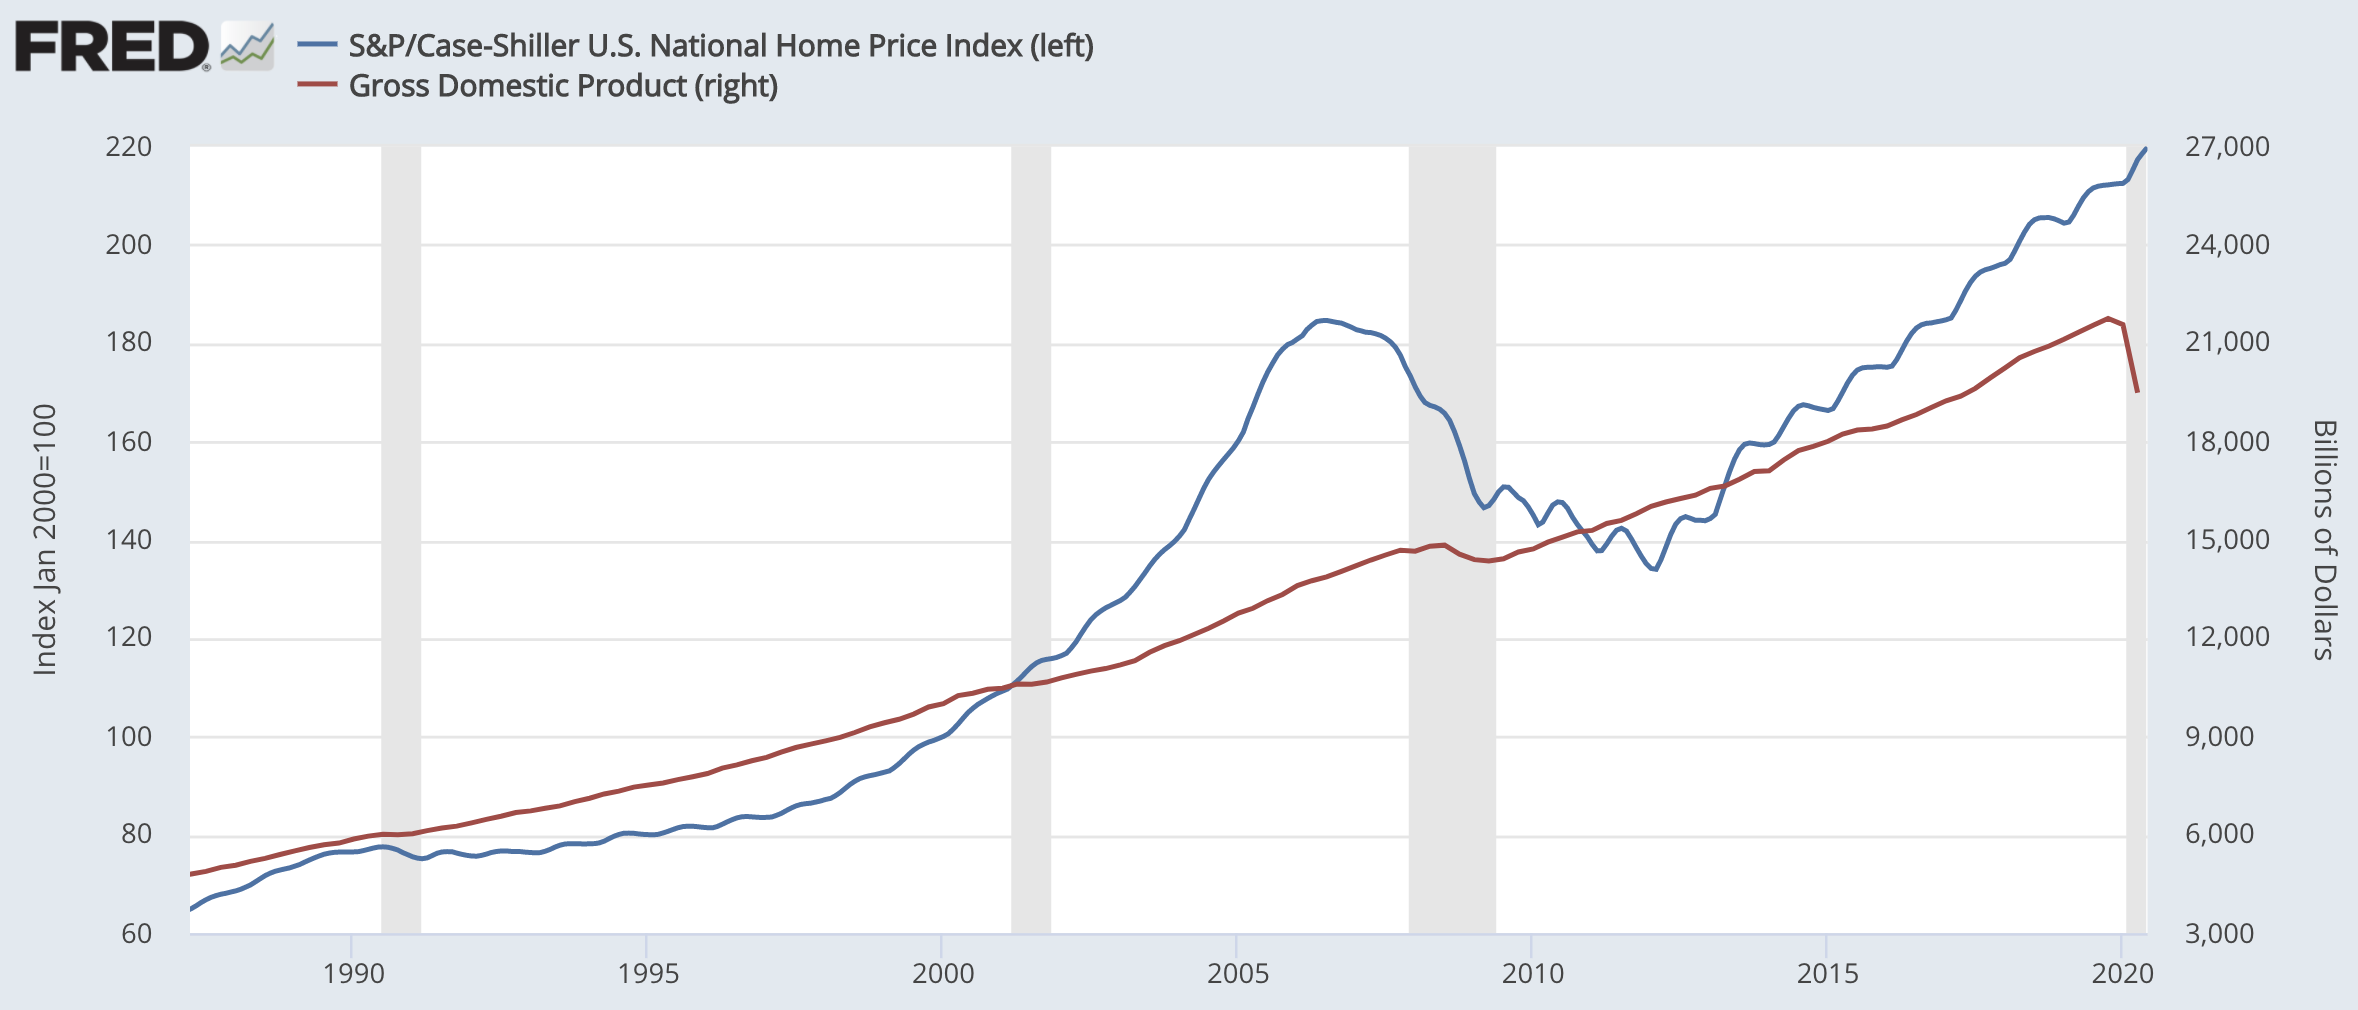
(Sources: S&P Dow Jones Indices LLC, U.S. Bureau of Economic Analysis)
The flaws in central bank policies often lead to these problems in the first place.
Central banks typically target a mandate of either:
a) inflation (i.e., price stability) or
b) inflation and growth (full employment within the context of price stability)
The implication is that they typically don’t place much attention on the debt growth that’s occurring to finance the creation of bubbles.
If growth and inflation don’t appear to be strong or the central bank is actively stimulating the economy, this can facilitate excess speculation in the financial economy with the hopes that some of that wealth creation will eventually get into the real economy.
However, a central bank is heavily responsible for all debt in an economy given their pulling on their levers influences incentives.
It’s important for them to keep debt growth at a reasonable level with a focus on keeping it neither too high nor too low relative to income (i.e., such that it can be serviced).
Some policymakers will counter this point saying that it is too difficult to ascertain whether a bubble is occurring, that “engineering” the financial markets is beyond their scope or duty, and that growth and inflation is their given mandate.
However, they do control the amount of money and credit in an economy.
When that money and credit goes into debts that cannot be paid back or into risky assets whose earnings will never justify their valuations, that has big implications for growth and inflation down the line.
The biggest depressions occur when bubbles burst (e.g., 1929, 2008). If central banks are the ones producing the debt that are inflating these bubbles and they won’t control them, then the question becomes who will control them?
The economic pain of a 1929 or 2008 or the various bubbles throughout history is so high (and changes the economic, social, and political landscape of a country) that it is not sensible for central bankers to ignore them.
This is why a “credit growth in line with income growth” mandate is so important rather than merely managing the business cycle, or the trade-off between employment and inflation.
When inflation runs above an acceptable level, it’s common for central bankers to raise short-term interest rates. But normal monetary policies of short-term rate adjustments are largely too broad and non-specific to sufficiently manage bubbles.
This is because bubbles often manifest in certain parts of an economy and not in others.
For example, in the 1998-2000 period, it occurred in technology and internet companies. From 2004-08, residential housing became a problem.
Basic short-term interest rate adjustments are not usually appropriate for some sectors relative to others.
During this time, central banks are likely to fall behind the curve. Some borrowers may not be squeezed yet by the higher debt servicing costs.
When interest payments are typically being met through newly borrowed funds instead of income growth, EBITDA, or a similar earnings metric, this is a warning signal that the trend isn’t sustainable.
When the bubble goes into reverse, the same linkages on the way up – i.e., more borrowing leading to higher spending, leading to higher incomes, leading to more investment, which creates more valuable collateral and more borrowing, etc. – create the same downward spiral and become self-reinforcing.
Falling asset prices cause asset and collateral values to drop.
Since assets are typically bought on leverage, they often get squeezed out due to liquidity problems. Lenders pull back. Speculators need to sell, people have the increased need to raise cash to make debt payments and normal spending needs so assets are sold off, which drives prices down even further.
Lenders and investors also take their money out of risky assets and financial intermediaries that may have built-up leverage and bad debt problems from the run higher.
When these leveraging problems occur within key intermediaries or enough people are affected, this often becomes systemically threatening. In other words, they can threaten the viability of the entire economy.
How to Identify Bubbles
After previous bubbles, regulatory measures often help clean up the problems where they occurred.
For example, the high-profile Enron and Worldcom accounting frauds helped spur the Sarbanes-Oxley Act to help improve the transparency of corporate accounting.
The housing problem and the buildup of subprime mortgage debt within large commercial banks saw response with the Dodd-Frank Act and Federal Reserve stress tests.
The specifics differ across cases. The size of the bubble is different. It affects different asset classes and different industries. The nature of the bubble popping is different (e.g., slow deflation, violent burst), and so forth.
That said, the nature of bubbles is such that they are more similar than different and they can be understood by looking at their cause-and-effect relationships.
Knowing what to look for and having a mental picture of what they are makes it easier to identify them.
And while there are overall markets that may be in bubbles (either at the economic, sector, or even specific asset level), there are also second- and third-order effects of bubbles popping.
For example, the 2008 financial crisis had a bubble in subprime housing.
The knock-on effects of that eventual collapse was based on who held exposure to that debt, which were primarily the commercial banks and those of lower and middle incomes who were brought into the housing market and would lose their homes.
And they were leveraged in such a way that made the potential insolvency of some systemically threatening to the entire economy.
So, it’s important to know who’s connected to them.
For example, if you take a common example of a stock bubble, such as Tesla (TSLA), you might look at how a bursting of that kind of bubble might impact those who hold its equity and debt.
The defining features of a market bubble
Bubbles are most commonly identifiable due to:
1) Prices being high relative to traditional measures. For example, if stocks have a forward yield of two percent, a rise in inflation or normalization in real rates could compress their multiples and hurt the most leveraged companies.
2) Prices are discounting high levels of earnings that aren’t likely to be justified.
3) Purchases of assets are commonly done with high leverage.
4) Bullish sentiment is broad (e.g., few bearish investors, survey data).
5) There is a wave of new buyers in the market who are inexperienced, speculating on assets they don’t understand well, don’t know how to price, are driven by narratives and groupthink rather than a careful analysis of future earnings potential, and riding the wave on the most popular assets.
6) Monetary policy is stimulative and pushing asset prices higher.
7) Buyers are making extended purchases of goods such as supplies and inventory to either speculate or help insulate themselves from future price gains.
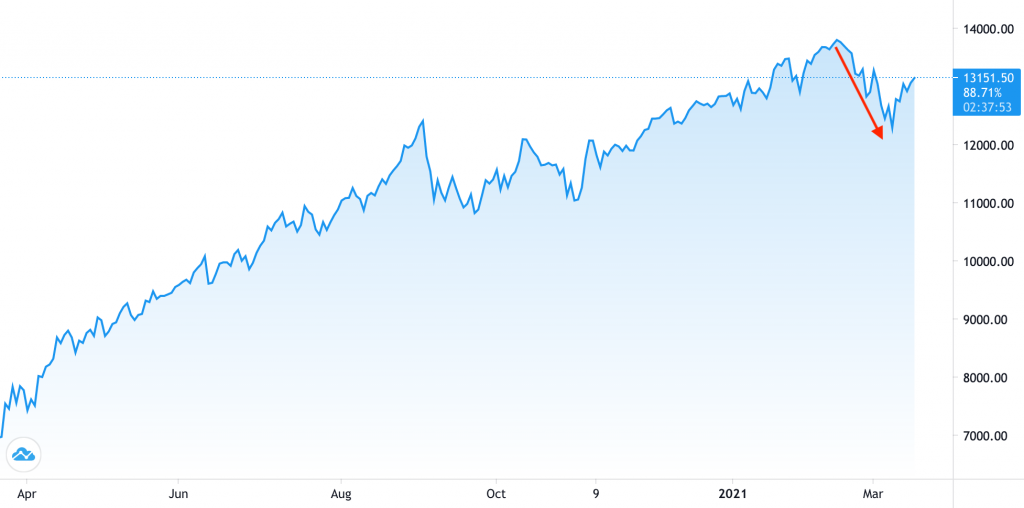
A modest tightening in monetary policy or in longer duration bond yields would threaten the bubble.
This occurred for emerging tech in March 2021, which saw a pullback of more than 20 percent (a “bear market”) in some of the most overvalued companies and about a 10 percent overall correction in the NASDAQ index.
(Source: Trading View)
A rise in yields impacts the assets that are the most overvalued and those with lower quality balance sheets, which makes them vulnerable to being squeezed.
Investors can measure the estimated duration of the assets they own and what a modest tightening in monetary policy would do to its price.
For example, if an asset has a forward yield of two percent and is a perpetual cash flow instrument (i.e., a stock), that means its earnings multiple is the inverse of that, or 50x.
That means a one percent rise in rates could potentially cut the value of the asset in half, multiplying that one percent by the effective duration of the asset.
Multiple metrics must be considered when assessing a bubble
Any one metric is not a reliable indication that a debt crisis or “popping of the bubble” is at hand.
Debt to income, while a common way of looking at the health of an economy, is not reliable because it ignores the debt servicing component. But even debt service payments relative to income is not adequate either.
To know what’s going, one has to get at the specific debt service requirements of individual entities. Looking at the averages is not enough because problems that exist or are emerging in specific entities are lost by looking at broad metrics.
A high level of debt to income or debt servicing requirements relative to income is not as problematic if it’s distributed across the economy.
When it’s concentrated in certain sectors (or even companies), that is where systemic problems can emerge. This is particularly true if they are large or concentrated within key entities.
2008 and commercial banks
For example, 2008 was a bad crisis because the subprime mortgage problems were concentrated within large over-leveraged commercial banks.
If those banks failed, that would mean people losing access to their money, their money market accounts, brokerage accounts, lending services, and so forth.
While it is socially and politically controversial to save imprudently managed companies, the costs of not saving them are higher than the costs of saving them.
What causes asset bubbles to pop?
No specific event or shock typically causes a stock market bubble (or any type of bubble) to burst.
However, they commonly burst due to the influence of higher interest rates.
Classically, bubbles develop because rising prices require buying on leverage to keep accelerating at an unsustainable rate.
This is because both lenders and speculators are near or at their maximum positions and because tightening changes the economics of the leveraging up process.
Systemic problems in non-traditional entities
While traditional lending institutions are commonly sources of these problems, they do occur in other entities as well.
Long-Term Capital Management was a hedge (part of the lightly regulated non-bank “shadow banking” system) that became systemically to the global financial system in the late 1990s by making relative value trades with high leverage.
The original core strategy of the fund relied on trades predicting the convergence of the spread between “off-the-run” and “on-the-run” bonds in fixed income futures markets.
Because the spread involved in most relative value and arbitrage trades is so small (particularly in the case of true arbitrage trades), the fund leveraged up many times to generate the high annualized returns (over 40 percent) in its first few years.
Because LTCM was successful at exploiting these relative value and arbitrage opportunities, and the intellectual capital of their team was so high (it included Nobel Prize winners, among many other accomplished people), more investors wanted to invest with them.
This caused their assets under management to grow at the same time these opportunities were being arbitraged out of the market, both by themselves and other competitors looking to copy them.
After all, they were considered to be on the forefront of investing at the time and any valuable opportunities with reasonable margins to them attract competition regardless of the business.
To obtain their desired results, they increased their leverage and were forced to allocate capital to second- and third-tier ideas – namely, markets and trades that were beyond the initial scope of their expertise.
They went into strategies such as merger and acquisition (M&A) arbitrage, and standard long and short directional bets. They also applied strategies to less liquid emerging markets after previously focusing mostly in more liquid developed markets.
Going into 1998, even though the firm’s assets under management were $5 billion (high, but not uncommon), its notional exposure to the markets was well over $1 trillion (200x-250x leverage).
In the late 1990s, that was over 10 percent of US GDP at the time.
When leveraged 200x, that means a mere 50-bp swing in the fund’s equity position would effectively wipe out the entire capital base.
In the summer of 1998, markets were volatile due to the fallout from currency crises in developing Asian markets from the year before, and Russia was nearing a point where it would have to devalue its currency and eventually default on its debt.
On top of that, Salomon Brothers, one of LTCM’s counterparties, decided to exit the arbitrage business entirely. This caused a widening in the spreads of LTCM’s trades with less liquidity in those markets.
Russia’s problems led to a reduction in “risk on” trades and a flight into global safe haven assets (e.g., US Treasury bonds, gold, yen). This caused a further widening of the spreads on LTCM’s relative value and arbitrage trades.
Moreover, the run-up in tech shares would soon become the story of the late 1990s.
The NASDAQ “dot com” bubble was starting to begin, where long-term fundamental valuations of tech companies were misunderstood or virtually ignored as part of the euphoria.
Many new traders entered the market with the adoption of the internet, PC, and the drop in commissions from the rise of the online broker and consequent rise of day trading for the retail trader.
After Alan Greenspan’s “irrational exuberance” speech on December 5, 1996, which warned of high valuations in the equity markets and excess speculation, the NASDAQ would eventually quadruple its valuation from that point forward until its top.
Due to a confluence of factors where the markets were not acting on the basis of sound fundamentals, LTCM’s losses began to stack up.
Because of the size of the fund’s positions, compounded by its imprudent use of leverage, liquidating them was not feasible.
The fund’s counterparties also began to understand the scope of LTCM’s problems – which meant their own problems.
This, in turn, led to the hedging of counterparty risk specific to themselves. This dispersed LTCM’s issues to more and more entities in the financial system and led to even worse problem’s for LTCM itself.
To avoid default, and potential systemic issues for the economy at large, the Federal Reserve Bank of New York stepped in to negotiate a bailout package with LTCM’s creditors.
While LTCM had assembled an incredible team of very intelligent people, it illustrates the severe inadequacy of bad assumptions in risk management, such as the inappropriate use of using the past to inform the future.
Markets are not like a game of chess where you can look at what worked in the past, or what can work based on a fixed set of rules within the context of a closed system, and expect it to work like that in perpetuity.
That type of extrapolation can be logical where you know previous environments will work exactly like future environments.
The financial markets are not like that, as they’re an open system not constrained by a fixed set of variables.
Market history is rife with ostensibly low probability events that occurred due to inaccurate estimations of their actual probabilities.
If you become a material portion of your market, that can become a problem because of the liquidity premium associated with that.
Similar to the concept of a cornering a market in anything, when anyone becomes a material part of one’s markets, the possibility of getting squeezed gets higher.
The case of Tesla
Tesla is a car manufacturing company with around a one percent share of the global auto market (a number that isn’t growing), ranks last among the players in autonomous vehicle technology, yet by itself is worth ~5x the entire US auto market cap, nearly 2x the entire European auto market cap, and more than the entire Japanese market cap.
It makes no money selling cars, producing profits through inflation in their accounts receivable, expense misclassification/capitalization, and the sale of ZEV credits (a form of environmental subsidies).
Even if we take its $24 billion annual revenue figure at face value, at a $500+ billion market cap, that means buyers (as this is being written) are buying the company at 21x revenue.
To justify that valuation, that means for shareholders to get their principal back in 21 years have to be paid 100 percent of revenues for 21 straight years in dividends.
That assumes zero cost of goods sold, which is impossible for the manufacturing and materials heavy auto sector.
That assumes zero expenses, which is impossible for the capital-intensive, thin-margin auto sector. (Auto companies tend to break about even on the initial sale and try to make a profit off parts and services fees.)
That assumes no taxes are to be paid. And for shareholders, that assumes no taxes paid on the dividends or distributions from the company.
And that assumes no capital expenditures and no research and development (R&D) for the next 21 years.
Those assumptions are all of course non-viable, and why it doesn’t make sense to buy a slice of a tiny car manufacturing operation priced at $500 billion unless the idea is to join “the greater fool game” and speculate in the market in the hopes of trying to sell it at a higher price.
It’s another example of a localized (i.e., company-specific) bubble. And when we’re talking $500 billion in market cap, we’re now talking around 2.5 percent of the entire US gross domestic product.
That makes it a systemically threatening entity in some form.
If the Tesla bubble deflates (or the company eventually comes under fire for its aggressive/dubious accounting), what will be the residual effects throughout the economy on those with exposure to its equity and credit?
While those who have long exposure to a bubble enjoy the ride on the way up, it’s just like any other form of indebtedness.
People, especially those with leveraged exposure, get squeezed on the way down with no economic income available to justify its valuation.
What they think is an asset isn’t actually an asset at all, but rather simply a conduit for speculative activity.
Quantitative easing and asset bubbles
When a central bank embarks on quantitative easing, it is effectively creating more money and pumping it into the economy.
This extra cash can cause asset prices – such as property and stocks – to rise. This increase in asset prices can reach the stage of a bubble where further price increases are not likely.
Asset bubbles can have harmful effects on an economy.
When the bubble eventually bursts, those who have bought assets at inflated prices can find themselves significantly out of pocket. This can lead to a sharp fall in consumer spending, which can in turn lead to recession.
While asset bubbles may be difficult to avoid entirely, central banks can take steps to manage them and mitigate their effects.
One way of doing this is by using macroprudential policy – that is, regulation and supervision targeted at specific risks in the financial system.
For example, banks may be required to hold more capital against mortgage lending, which can help to prevent a build-up of debt and limit the potential for house prices to spiral out of control.
When asset prices become too high, central banks can also take direct action to bring them down.
This might involve selling assets from their portfolios or raising interest rates.
By doing this, central banks can reduce the amount of money in the economy and help to avoid inflationary pressures.
Does the occurrence of asset bubbles mean investors are irrational?
Yes, it’s an example of irrational behavior. But they occur for predictable reasons and many traders even try to profit off them, knowing that a bubble is forming a potential quick profit opportunity.
It is important to remember that asset prices are determined by the collective actions and expectations of all market participants.
While some individual investors may be irrational, it is also possible for asset bubbles to form even when most investors are behaving rationally.
This is because asset prices can be driven by factors such as herd behavior, where investors buy assets simply because others are doing so, or because there is simply too much liquidity being produced and it’s going into all sorts of assets, overvaluing everything.
For example, if cash and bonds yield close to nothing and perhaps negatively in real (inflation-adjusted) terms, this can make entirely large asset classes unattractive.
This then drives people into stocks, real estate, private equity, cryptocurrency, NFTs, SPACs, algorithmic stablecoins, and other forms of speculation.
Even if you can accurately identify an asset bubble it can be hard to turn that realization into winning trade ideas.
As the old saying goes – “the market can stay irrational longer than you can stay solvent.”
How do asset bubbles cause recessions?
Asset bubbles can cause recessions via a negative wealth effect.
If people buy assets at high prices – and especially buy assets at high prices on leverage – the fall in price can be devastating to a lot of people.
Leverage magnifies both gains and losses.
If prices fall by 50 percent, a person with no leverage loses 50 percent, which is bad enough. But a person with 2x leverage loses 100 percent.
Asset bubbles and credit constraints
Credit constraints are an important factor that can amplify the effects of asset bubbles.
If people can only borrow a limited amount of money, then they won’t be able to buy as many assets even if prices are rising.
But if credit conditions loosen – for example, if banks start lending more money or if the government makes it easier to get a mortgage – then people will be able to buy more assets, which can drive prices up further.
Asset bubbles and monetary policy
Monetary policy can have a big impact on asset prices, both directly and indirectly.
The most direct way that monetary policy affects asset prices is through interest rates.
If interest rates are low, then it will be cheaper to borrow money, which can lead to more buying of assets such as property.
Furthermore, low interest rates tend to lead to higher stock prices, because they make it cheaper for companies to borrow money and because they reduce the returns from alternative investments such as bonds.
Indirectly, monetary policy can also affect asset prices by influencing the growth of the economy.
For example, if the central bank cuts interest rates in order to boost economic growth, this can lead to higher asset prices.
What are the most famous asset bubbles?
The most famous asset bubbles are probably the dot-com bubble of the late 1990s and the housing bubble of the 2000s.
The dot-com bubble was driven by irrational exuberance around the potential of internet companies.
Many investors were willing to pay high prices for shares in these companies, regardless of whether or not they were actually making any money.
As a result, stock prices soared to unsustainable levels, before eventually crashing back down to Earth.
The housing bubble was driven by a similar phenomenon, with many people buying homes at ever-increasing prices, often with borrowed money.
Again, prices reached unsustainable levels and then came crashing down, leading to a sharp increase in foreclosures and a deep recession.
Asset Bubbles – FAQs
What happens when an asset bubble bursts?
When an asset bubble bursts, the price of the asset falls sharply and quickly.
This can cause people to lose a lot of money and can lead to economic problems.
What causes an asset bubble?
Asset bubbles are often caused by too much money chasing too few assets.
This can happen when there is a lot of investment capital looking for somewhere to go.
They can easily develop when there are low interest rates and easy credit, which encourages people to borrow money to buy assets.
What are the consequences of an asset bubble?
The consequences of an asset bubble can be serious. When an asset bubble bursts, people can lose a lot of money.
This can lead to economic problems, such as recessions or depressions.
Asset bubbles can also cause financial crises, such as the housing crisis in the United States and other countries in 2008.
What are some examples of asset bubbles?
There have been many examples of asset bubbles throughout history.
Some notable examples include the stock market bubble in the United States in 1929 and the late 1990s, the housing bubble in the US in the early 2000s, and the commodities bubble in 2008.
How can I protect myself from asset bubbles?
There is no guaranteed way to protect yourself from asset bubbles.
However, there are some things you can do to reduce your risk.
For example, you can diversify your investment portfolio so that it includes a mix of different assets.
You can also pay attention to economic indicators to try to identify when an asset bubble might be forming.
If you are thinking about investing in an asset that has seen a sharp increase in price, you should be aware of the risks involved and be prepared for the possibility that the price could fall sharply.
How do you identify an asset bubble?
There is no sure way to identify an asset bubble. However, there are some warning signs that an asset bubble might be forming.
These include rapid price increases, high prices by traditional indicators (e.g., high P/E ratios), high levels of debt, lots of new buyers entering a market, and low interest rates.
If you see these warning signs, it’s important to be cautious before investing in the asset.
You should also be aware of the risks involved in investing in assets that have seen a sharp increase in price.
How can a central bank identify an asset price bubble?
A central bank can use a number of methods to try to identify an asset price bubble.
These include looking at the price of the asset, economic indicators, and financial market data.
If a central bank suspects that an asset price bubble is forming, it may take steps to try to stop it from growing.
For example, the central bank might raise interest rates or impose restrictions on lending.
However, central bank policy is often too broad to target bubbles directly.
This is because asset bubbles often develop in certain pockets of an economy but not others.
For this reason, macroprudential policies are often used that can be much more targeted.
What are macroprudential tools?
Macroprudential tools are policy measures that can be used to help reduce the risk of financial crises.
They are often used to target specific risks, such as asset price bubbles.
Some examples of macroprudential tools include capital requirements, loan-to-value ratios, and credit growth limits.
What is monetary policy?
Monetary policy is the use of interest rates and other tools by a central bank to influence the economy.
It is often used to manage inflation and economic growth.
What is fiscal policy?
Fiscal policy is the use of government spending and taxation to influence the economy.
It is often used to manage economic growth and debt levels.
Should central banks consider asset prices when making policy?
The economic pain of allowing a large bubble to inflate and burst is very high, so it can be easily argued that it is not prudent for economic policymakers to ignore them.
That said, it’s not always obvious when an asset bubble is forming and is often mistaken for new innovation or growth, so it is often hard for central banks to know when to act.
There is also the risk that if central banks try to deflate a smaller bubble, they might unintentionally cause a recession.
For these reasons, many economists believe that central banks should only take action to deflate an asset price bubble if it is very large and poses a serious threat to the economy.
How do bubbles affect the economy?
Bubbles can have a number of different effects on the economy.
For example, they can lead to higher levels of debt and inflation.
They can also lead to economic instability and even recession.
In some cases, bubbles can also have a positive effect on the economy.
For example, they can lead to new innovation and growth.
However, the risks associated with asset bubbles are usually greater than the potential rewards.
This is why it’s important to be aware of the risks before investing in an asset that has seen a sharp increase in price.
Does quantitative easing create asset price bubbles?
Quantitative easing is a policy that is often used by central banks to increase the money supply.
It is often used during times of economic difficulties, such as when short term interest rates are low and inflation is low.
Some people believe that quantitative easing can lead to asset price bubbles through its ability to overstimulate economies.
What are the risks of investing in an asset that has seen a sharp increase in price?
There are a number of risks associated with investing in an asset that has seen a sharp increase in price.
These include the risk of the asset price bubble bursting, the risk of inflation, and the risk of recession.
Before investing in an asset that has seen a sharp increase in price, it is important to be aware of these risks.
Why are asset prices not included in inflation?
Inflation typically means the rise in the prices of goods and services.
Asset prices are not included in inflation because they do not directly affect the prices of goods and services.
However, asset price bubbles can indirectly lead to inflation by causing an increase in spending via higher wealth.
What is the difference between an asset bubble and inflation?
An asset bubble is a situation where the price of an asset rises sharply and then falls back down over a period of time.
Inflation is a sustained increase in the prices of goods and services.
Asset bubbles can lead to inflation, but they are not the same thing.
What are the risks of a housing bubble?
A housing bubble is a situation where the prices of houses rise sharply and then fall back down over a period of time.
The risks of a housing bubble include the risk of default, the risk of foreclosure, and the risk of inflation.
Before investing in the housing market, it is important to be aware of these risks.
What happens when an asset bubble bursts?
When an asset bubble bursts, the prices of the assets involved fall sharply.
This can lead to a rapid loss in wealth for many and recession.
For this reason, it is important to be aware of the risks before investing in any asset, especially assets that may suddenly become “hot”.
Why are asset price bubbles not sustainable?
Asset price bubbles are not sustainable because the prices themselves reflect unsustainable conditions.
For example, if a stock discounts high future growth and this growth cannot be realized, then the stock at some point will need to fall.
Speculators at a point will become leveraged long and adopt max positions that cannot be sustainably increased.
Bubbles can also form around assets whose prices are low relative to their fundamental value.
Investors and traders may buy these assets, driving up the price, but eventually they will realize that the asset is not worth what they paid and sell it, leading to a sharp price decline.
Conclusion – Asset Bubbles
Asset bubbles occur when the price of an asset rises sharply and then falls back down over a period of time.
They can lead to inflation in goods and services and eventual recession due to the misallocation of capital they can create.
In this article, we covered the lead up and signs of a market bubble, as they typically apply to developed market economies.
(For emerging market economies, which typically have inflationary recessions, we covered this in more detail here.)
In the next part of this series we will cover the markings of a market top and how the cycle plays out from that point forward.
Part II: Characteristics of a Market Top
