Investing in Gold: Its Role in a Portfolio


Investing in gold is not usually the first allocation priority in most people’s portfolios. It does, however, have an important role to play when it’s allocated in the right amount that can both enhance returns and reduce risk.
Gold is treated much closer to a monetary asset or a currency than a commodity subject to supply and demand considerations.
Certain supply-demand dynamics, such Indian demand for gold for jewelry, for example, are insignificant to the overall market. Taking India as a whole, it’s only a bit over one percent of the total market.
The main sources of demand in the global gold market are central banks and reserve managers – the US, developed Europe, the International Monetary Fund (IMF), Russia, and China.
Gold reserves increase by about only 1 percent per year. This is on par with palladium (relative to the size of the market), which is also useful to own in some quantity, and close to twice the rate of production of platinum, also when taking the relative size of the market.
Gold’s main long-run valuation is proportional to fiat reserve and currency growth relative to the global gold reserves.
Gold’s role in portfolios
Gold is an important piece, but not the best overall investment over time. It tends to perform a little better than cash, but it is still only a cash alternative.
There’s a time where it does well and a time where it does poorly. But in a small quantity, it can be both risk-reducing and return-enhancing to have gold in a portfolio.
If we take some example portfolios, we can bear this out empirically.
Three portfolios without gold
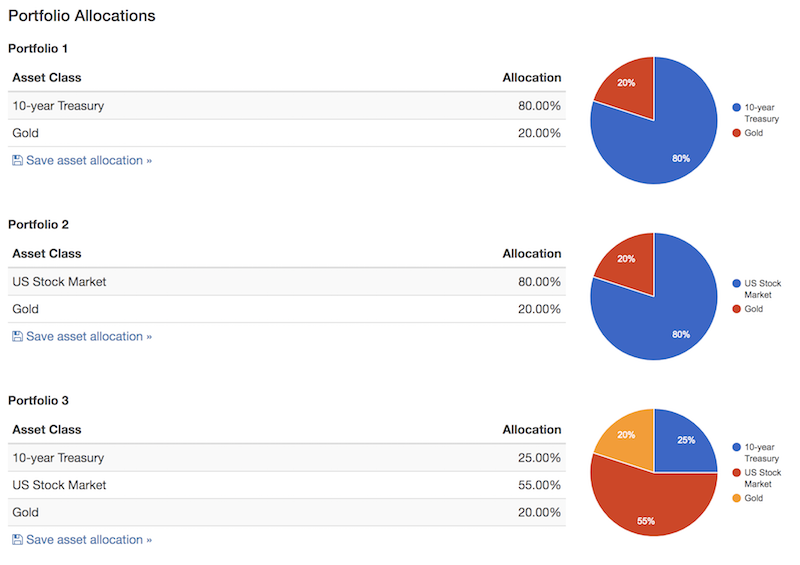
Let’s take three different portfolios of stocks and bonds. Stocks are US equities and bonds are 10-year US Treasuries.
We have one portfolio concentrated in stocks, one concentrated in bonds, and one balanced between the two on the basis of risk.
Portfolio 1 = 100 percent 10-year US Treasuries
Portfolio 2 = 100 percent US stocks
Portfolio 3 = 35 percent US stocks, 65 percent US Treasuries
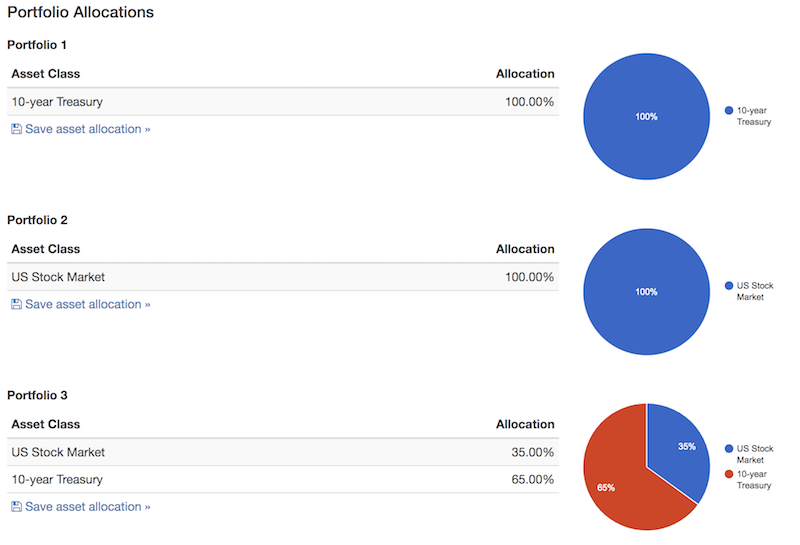
(Source: portfoliovisualizer.com)
___
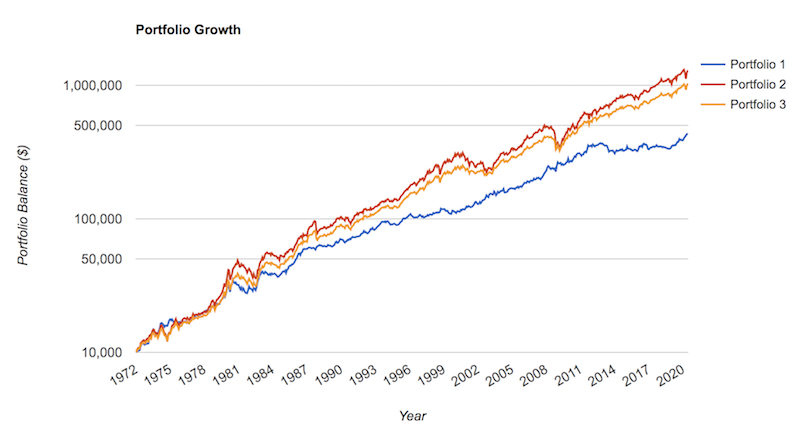
Performances of each portfolio over time
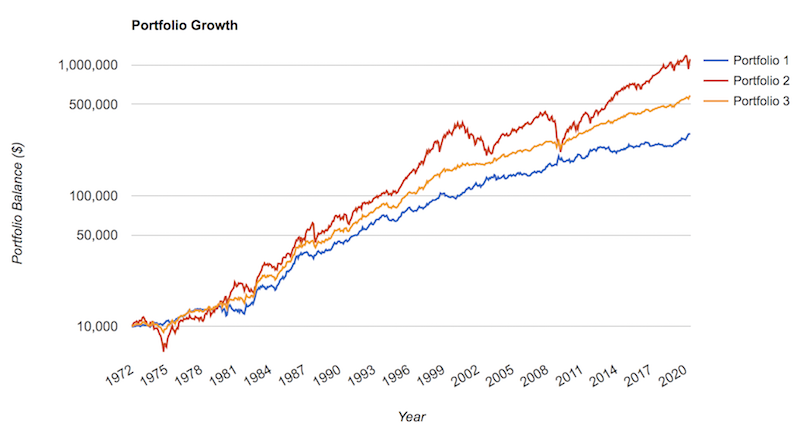
Table of performances over time
| Portfolio | Initial Balance | Final Balance | CAGR | Stdev | Best Year | Worst Year | Max. Drawdown | Sharpe Ratio | ||
|---|---|---|---|---|---|---|---|---|---|---|
| Bonds | $10,000 | $297,728 | 7.26% | 8.06% | 39.57% | -10.17% | -15.76% | 0.34 | ||
| Stocks | $10,000 | $1,110,608 | 10.22% | 15.59% | 37.82% | -37.04% | -50.89% | 0.41 | ||
| 35/65 | $10,000 | $584,396 | 8.77% | 7.69% | 32.90% | -7.11% | -16.60% | 0.53 |
Portfolio 2, the stocks portfolio, does the best over time, as it does in each of our examples. This is expected because it contains the highest risk. Note the much worse volatility (standard deviation), worst year, and maximum drawdown metrics. Adjusting for risk, it does not do the best.
The 35/65 portfolio did the best over time because it’s the best balanced of the three.
That type of allocation best equalizes the risk of the higher-volatility stocks with the lower-volatility bonds. Every asset class does best in a certain environment.
We cover more on how to build a balanced portfolio in a separate article.
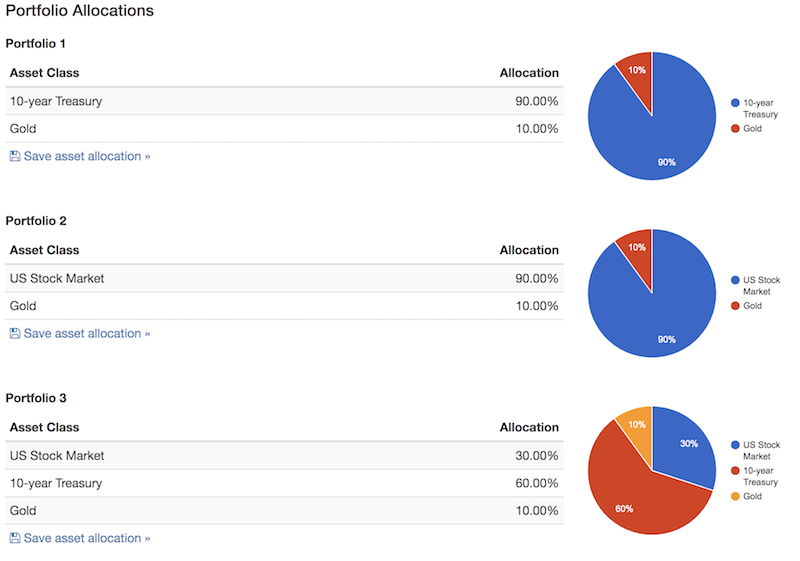
Three portfolios with gold
We take the same portfolios, but with a 10 percent allocation to gold.
In the first two portfolios where the allocation is entirely in one asset class, we strip it back to 90 percent.
In the third portfolio, we cut the stocks allocation back to 30 percent from 35 percent and the bonds allocation back to 60 percent from 65 percent.
___
Performances of each portfolio over time
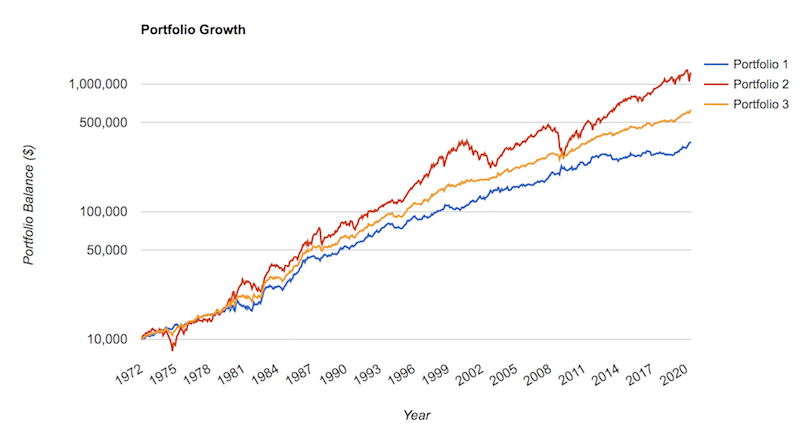
Table of performances over time
| Portfolio | Initial Balance | Final Balance | CAGR | Stdev | Best Year | Worst Year | Max. Drawdown | Sharpe Ratio | ||
|---|---|---|---|---|---|---|---|---|---|---|
| 90B/10 | $10,000 | $350,101 | 7.62% | 7.68% | 37.11% | -10.55% | -16.62% | 0.40 | ||
| 90S/10 | $10,000 | $1,234,532 | 10.46% | 14.15% | 34.48% | -32.84% | -45.41% | 0.45 | ||
| 30/60/10 | $10,000 | $628,812 | 8.93% | 7.27% | 31.39% | -4.58% | -11.94% | 0.58 |
We can see each portfolio has higher returns with lower risk relative to our base portfolios above. In the trading and investing world (and many other business pursuits), you’re always looking to get more with less risk.
We also see this reflected in the Sharpe ratio, which is a way to measure excess returns over excess risks. Each sees an improvement.
Three portfolios with “too much” gold
It’s important not to overemphasize anything.
Being a proponent of owning a bit of gold as part of one’s strategic asset allocation mix is not the same thing as “being wild on gold” or being a “gold bug”.
There’s such a thing as too little or too much.
If you have too little, you’re not going to benefit from the diversification benefits.
If you have too much, your portfolio will get out of balance. You never want to have too much risk in any given thing.
In this case, we’re going to run the same exercise but now gold is 25 percent of the allocation.
That means for ‘Portfolio 1’, its allocation is now 75 percent bonds and 25 percent gold.
For ‘Portfolio 2’, its allocation is now 75 percent stocks and 25 percent gold.
For ‘Portfolio 3’ (originally the 35/65 stocks/bonds mix), it is now 22.5 percent stocks, 52.5 percent bonds, and 25 percent gold.
___
Performances of each portfolio over time
We do see that the performances of the bonds- and stocks-only portfolios continue to improve on a risk-adjusted basis.
But this is because those portfolios weren’t well-diversified to begin with. An asset that has positive returns over time, isn’t excessively risky, and has no long-run correlation to stocks or bonds is going to provide more benefit up to a point. Adding up to 25 percent gold in the allocation actually improved the risk-adjusted returns accordingly.
However, in the diversified portfolio that already had a relatively equitable risk-based allocation to stocks and bonds, we see the risk-adjusted returns start to suffer. In this case, 25 percent in gold is too much. For an already well-diversified portfolio, around 10 percent is a better allocation.
Table of performances over time
| Portfolio | Initial Balance | Final Balance | CAGR | Stdev | Best Year | Worst Year | Max. Drawdown | Sharpe Ratio | ||
|---|---|---|---|---|---|---|---|---|---|---|
| Portfolio 1 | $10,000 | $435,384 | 8.11% | 8.76% | 39.24% | -14.50% | -20.67% | 0.41 | ||
| Portfolio 2 | $10,000 | $1,297,750 | 10.57% | 12.59% | 54.94% | -24.45% | -33.53% | 0.49 | ||
| Portfolio 3 | $10,000 | $1,032,938 | 10.05% | 10.04% | 44.78% | -13.59% | -21.80% | 0.54 |
Let’s look at the other benefits to investing in gold.
A long-term store of value
Gold has maintained value over thousands of years, unlike fiat currencies, which rise and fall with the empire and/or regime. People have used gold as a store of wealth and as a way to pass wealth down over generations.
For more than 2,000 years gold has also been a form of exchange(though to a lesser extent in modern times), which forms the other main characteristic of what constitutes a currency. Due to its chemical properties, gold doesn’t corrode. It also melts at a reasonable 1,948 degrees Fahrenheit (1,064 degrees Celsius), which makes it easy to melt down or stamp.
Financial wealth is more fleeting
Cash and bonds
Of all the fiat currencies that have existed within the past 500 years, less than five percent of them still exist.
Stocks
Companies also come and go.
The most valuable companies today are businesses that are more or less new within the past 15-30 years.
Picking the winners and losers is hard to do. What the best companies are changes over time. IBM was the leader of the tech world in 1990, but didn’t adapt to a changing tech world. Walmart was the king of retail in the same year, but missed the shift to online shopping and has been inadequately playing catch up with Amazon ever since.
The landscape will continue to develop in ways that are hard to predict specific winners and losers.
By mid-century, digital technologies will continue to evolve toward artificial intelligence and its related genres (machine learning, deep learning, reinforcement learning) and companies will work to commercially apply them to a host of applications to create value.
Some companies will do this successfully while some of the current stalwarts will decline. Many ideas will come out of the venture arm of established tech players today and become a business enterprise outside of it.
When everybody thinks the same thing and it’s a sure bet (like the Nifty Fifty of the 1970s), it’s almost certainly reflected in the price. Accordingly, betting on it is probably not going to meet one’s expectations. The usual coterie of tech companies that go by various abbreviations – FAANG, FAAMG, FANGAM, or whatever one’s preferred label – are big, important companies. But if you look at their prices relative to what they’re likely to earn over the next 5 to 10 years, they are not cheap.
It’s a risk to have all wealth in only financial form, whether based in cash, bonds, and stocks.
This is where alternative stores of wealth, such gold, other precious metals, commodities, land, and other hard assets come into play.
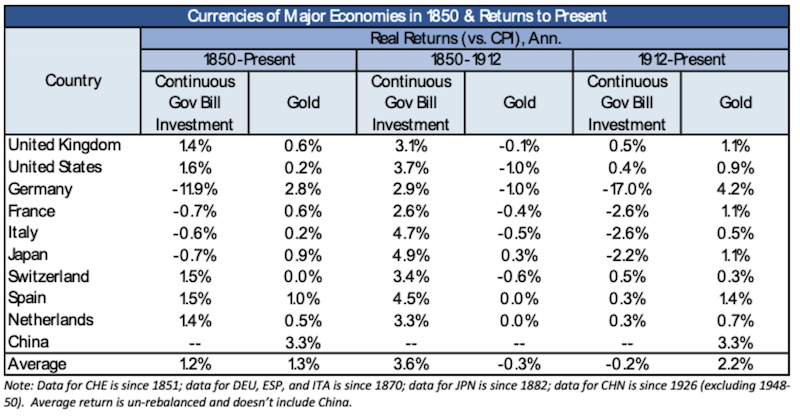
Cash and gold returns since 1850
A few basic points:
1. If we take a look at how cash has performed since 1850, the average annual real (i.e., inflation-adjusted) return of cash (i.e., currency that earns interest) has been 1.2 percent.
This is slightly lower than real return of holding gold, which has been 1.3 percent.
However, their returns at various points have been very different depending on where you go. This has been due to various events, such as political instability, revolutions, wars, debt crises, bouts of bad inflation or hyperinflation, decline as an empire, and so on.
2. Since 1850, in roughly half the countries you would have received a positive real return by investing in bills (i.e., short-term cash). In the other half, you would have received a negative real return. In some places, you would have lost all your money investing in them. In Germany this happened twice.
3. Typically, real returns from holding interest-bearing cash currency came during periods when countries were on gold standards.
Gold standards were used, and in a sustainable way, because they were in periods where debt servicing burdens were low and growth in economic output was close to debt growth. Capital flows were also not a big issue that would materially alter exchange rates. In the US, for example, this included the second Industrial Revolution and the post-World War II period.
4. The real return for short-term government debt has been minus-0.2 percent since 1912.
The real return on gold over this period has been 2.2 percent.
Over this period, you have made a positive return in about half the countries and lost meaningful amounts of money in the remainder. France, Italy, and Japan have lost more than 2 percent per year. Germany has lost over 15 percent per year due to their hyperinflation and double wipeout.
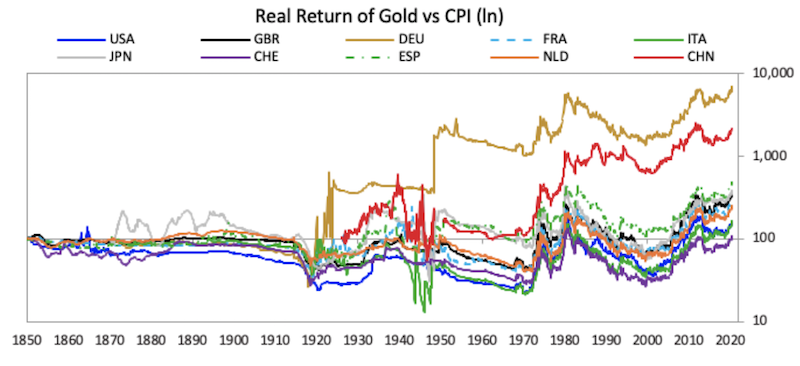
Toward the end of this section below, you can find the real returns of holding gold from 1850 to the present.
From 1850 to 1971 (i.e., the end of the Bretton Woods monetary system), gold returned an amount that equaled the amount of money lost to inflation, excluding Germany.
There are large moves around that average. In the 1930s there were many currency devaluations to deal with debt problems that had emerged and led to the Great Depression. Also, at the end of World War II, there were devaluations that were part of the creation of the Bretton Woods monetary system in 1944.
The currencies and debts of China, Germany, Japan, and Italy were wiped out upon the implementation of this monetary system. The winners of the war had their currencies depreciated materially, but more slowly.
Gold remained steady in price as money and credit expanded until 1971. In the United States, under Executive Order 6102, gold ownership was banned from 1933 to 1975 due to avoid hoarding and get more cash into the economy. Some minor exceptions existed, such as some collector coins and jewelry, though some relaxations came into place in 1964. Banishment of monetary systems that exist outside the government’s control are always at this type of risk.
In 1971, the US unilaterally broke the convertibility peg between gold and the US dollar.
During the 1968 to 1973 period, there was a lot of spending in excess of income, which led to debt creation in the US especially. Being on the gold standard, this debt creation was unsustainable as these systems specifically type to constrain this behavior.
Claims on gold were being redeemed for actual gold. And the claims were larger than the actual amount of gold available. This prompted the dropping of the gold standard in August 1971.
Currencies were devalued and the US shifted from a commodity-backed monetary system to a fiat system. That helped the government (i.e., the Federal Reserve) create money and credit on an unconstrained basis.
That consequently led to high inflation. Nominal interest rates rose, but real interest rates were low. This led to a big appreciation in gold prices until 1981. To get out of the inflationary malaise, Fed chairman Paul Volcker raised interest rates above the inflation rate (i.e., increased real interest rates). This caused currencies to rise and gold fell until 2000.
In 2000, the dot-com bubble popped. After this, central banks lowered interest rates relative to inflation rates.
After the 2008 subprime bust, nominal interest rates couldn’t be lowered any further through normal means. So, they created money and bought financial assets. This helped support the price of gold.
The 2020 virus-related bust also led to large-scale printing of money. Two of the main three reserves currencies (EUR, JPY) already had negative nominal short-term interest rates (and in some cases, negative long-term interest rates).
The US also dropped their short-term rates to zero. All bought financial assets and head toward versions of rarely employed policies. This has helped support gold prices further and push it to new highs.
Since 1600, the three main global powers have been the Dutch, British, and American empires. They’ve also been the last three reserve currencies (the USD being the main current one).
Their returns relative to gold:
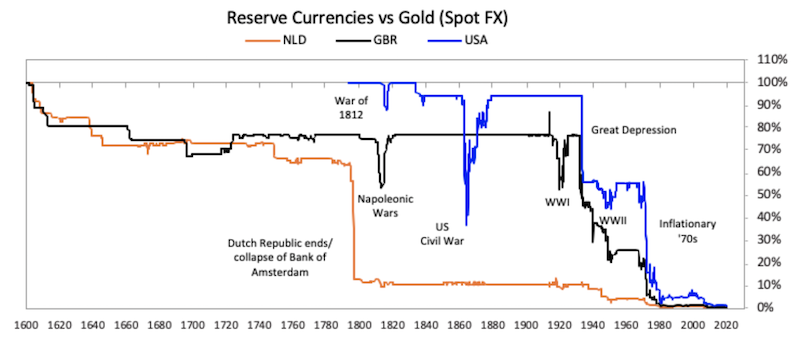
Historically, we’ve seen big currency devaluations usually following debt crises.
In recent history, since 2000, the value of money has fallen relative to gold due to:
a) large amounts of money and credit creation, and
b) real interest rates being low (i.e., interest rates being low in relation to inflation rates)
The monetary system has been one of free-floating exchange rates. Most countries have had independent monetary policies and free capital flows.
As a result, we haven’t seen the large abrupt breaks of the past. Instead, there’s been a more gradual devaluation.
Low, and in some cases negative, interest rates have not provided enough compensation to make all the new money and credit attractive to own, leading to more of the burden on central banks to buy it themselves.
Fundamentally weak US dollar
Gold typically benefits from a weaker US dollar. The USD is considered the world’s top reserve currency and gold is most responsive to real USD rates relative to any other currency.
In general, gold is an alternative when other currencies don’t work as well. When real rates are low, this decreases the incentive to hold interest-bearing currency.
On a technical level, entities all over the world value the US dollar. The US is now only 20 percent of global economic activity yet US dollars are 62 percent of foreign exchange reserves, 62 percent of international debt, 57 percent of global import invoicing, 43 percent of FX turnover, and 39 percent of global payments.
Fundamentally, the US will weaken long-term. Its current account deficit (the trade deficit is a component of the current account deficit) is around 2 percent of GDP.
It also has an unsustainable external debt to GDP of 45 percent. That means it has to issue a lot of debt to foreign entities to fund its deficits.
If the US ran balanced trade deficit, this would allow the external debt to shrink as a percentage of GDP.
Trade surpluses and trade deficits are zero-sum. That means large surpluses are generally frowned on given it means deficits exist somewhere else. Deficits need to be funded by issuing debt and can’t always be done adequately. This is particularly true if a country lacks a reserve currency.
Generally speaking, a +/- 3 percent surplus or deficit situation becomes hard to sustain. A surplus country can do it so long as it is not increasing foreign assets relative to GDP. A deficit country can do it so long as it is not decreasing its net foreign assets relative to GDP.
Where does the 3 percent come from?
Empirically, we can see that an external debt to GDP ratio of more than 40 percent doesn’t last. Countries typically default after some time when going above this level. It’s not only a lot of debt, but debt that has to be funded by foreign entities. The odds of default increase the higher the ratio.
Pre-2020, global growth rates were assumed at about 3 percent in real terms, or 6 percent in nominal terms (i.e., 3 percent real growth and 3 percent inflation).
If 40 percent is multiplied by 6 percent, this comes to 2.4 percent as a sustainable current account deficit. In other words, if your growth is at least your external debt relative to GDP multiplied by your growth rate, that means the deficit won’t continue to compound faster than the rate your output is growing.
Note that this also assumes that the deficit is financed in domestic currency. If you finance deficits in your own currency, then you can manage it. You can lower interest rates, extend the maturities, shift whose balance sheet it’s on, or depreciate your currency to improve the debt servicing.
If the debt is denominated in a foreign currency, you can’t control the debt because it’s under the monetary policy of a different country. Earning income in one currency and owing debt in another can be dangerous if the debt currency increases a lot. It’s like seeing a huge surge in interest rates.
If the external debt to GDP ratio goes up to 60 percent, then this 6 percent nominal growth multiplied by the figure is 3.6 percent (i.e., the current account deficit that is sustainable if the external debt to GDP ratio and nominal growth rate is sustainable).
If the 2.4 and 3.6 percent are averaged, that comes to 3 percent.
If global growth does not run as high, then the equilibrium deficit amount needs to come down.
Reserve currency countries can sustain larger deficits that other countries. It has higher demand for its currency and it also typically borrows in its own currency rather than foreign currency.
Countries that lack reserve currencies (i.e., emerging markets) typically borrow in cheaper currencies that have more demand. But this can cause them to get into the same problems over and over again (see Turkey, Argentina).
It also depends on a country’s net foreign asset position. If a country generates more income on its foreign assets relative to its foreign liabilities, this additional income can help support a higher balance of payments deficit if it needs to.
The US dollar provides safety and liquidity and its debt (US Treasuries) comprises the world’s top reserve asset. This gives the USD a lot of demand domestically and globally.
But the US is at risk of endangering that with its finances over time.
US finances
The national debt is the tip of the iceberg at not even 10 percent of all US liabilities.
– $26.2 trillion national public debt
– $53.4 trillion private sector debt
– $20.6 trillion Social Security liability
– $31.8 trillion Medicare liability
– $152.8 trillion unfunded liabilities
– Total: $284.8 trillion ($864k per person, $2.3 million per taxpayer)
Annual GDP is about $20 trillion. Federal take take of around $3.3 trillion; state and local another $3.3 trillion. Annual per-capita income is $60,300.
The debts and debt-like liabilities will never get paid.
Broadly, there are three ways to rectify problematic debt situations at the sovereign level:
1. Cut spending
2. Higher tax-take (more revenue does not always mean raising taxes)
3. Depreciate the currency
The US can’t cut spending enough and will never get the tax revenue. It has to go through the currency channel. In other words, a lower USD over the long-run is inevitable.
In general, it always goes through the third option because it’s discreet, stimulative, and politically palatable.
That the Fed has a ton of currency to print over the upcoming decades is an understatement.
It also brings up other important questions that most never ponder because it hasn’t happened before in their lifetimes (like debt crises, major public health issues, big natural disasters, economic shutdowns, etc.), but have happened over and over again throughout history.
In this case, it brings up a more fundamental question of what is the value of money?
In the developed world, fiat currencies are all fundamentally weak and don’t bear any interest, or barely any. In some cases, you have to pay interest to own it, opposite of the typical borrowing and lending relationship.
Interest rates can only go so negative before people turn to alternatives. It seems very unlikely that rates would go down to minus-400bps, for example.
At a certain point, it would make more sense to stack bank notes somewhere. The inflation and storage and security costs would be better than owning the currency (or debt) in digital form with a very negative interest rate.
Investors turn to reserve assets that have been tried and true, like gold and other assets whose values aren’t likely to erode over the long-run.
Investors need diversification in their currency mix, not just to other developed or emerging markets, but to different types of currency systems that we cycle through over and over again throughout history. It’s why it can help to own some gold, other precious metals, commodities, and other hard assets.
Even a gold ETF like GLD now holds about $65 billion assets.
Inflation hedging
Gold serves as the inverse of money. The inverse of money, over the long-run, is inflation.
Monetary inflation nonetheless doesn’t have to happen for gold to do well. As this is being written, gold is up over 30 percent year-over-year, yet inflation has been very mild.
Inflation expectations over the next 30 years in the US is at just 1.46 percent.
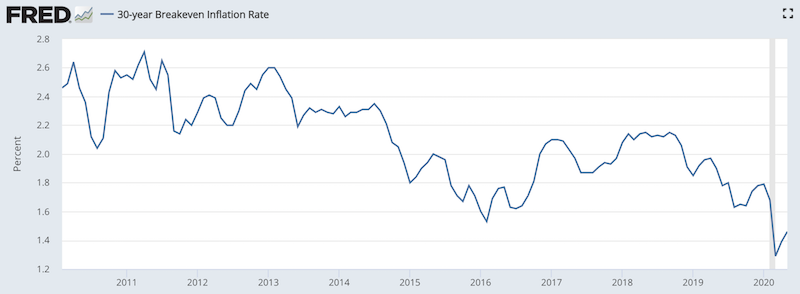
(Source: Federal Reserve Bank of St. Louis)
Year by year, most fiat currencies lose their purchasing power due to inflation.
Gold tends to keep its value over time because its priced relative to various fiat currencies. That makes gold effectively the inverse of money and thus rises over the long-run (with plenty of short- and medium-term volatility). Because societies and cultures attribute value to it, it’s used as a store of wealth and usually sees local inflows when the domestic currency is losing value.
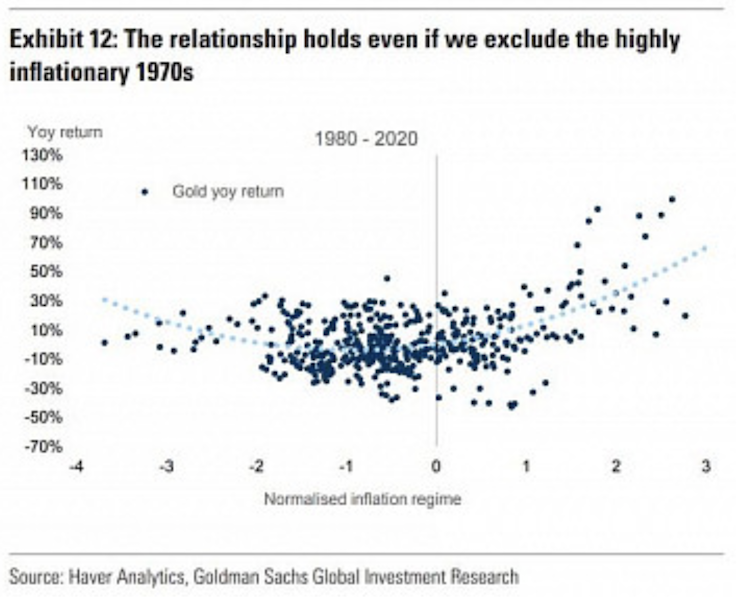
Gold’s relationship with inflation in not linear over time. Gold tends to not display a very strong correlation with inflation when it’s moderate. But it does begin to strongly correlate when inflation runs above a certain threshold.
The biggest driver of gold is when there’s a deviation from the inflation trend, not necessarily its absolute level.

This makes sense. The biggest driver of return for any asset is when the expectation of the future changes. All assets compete with each other for available liquidity (i.e., money and credit) in the system.
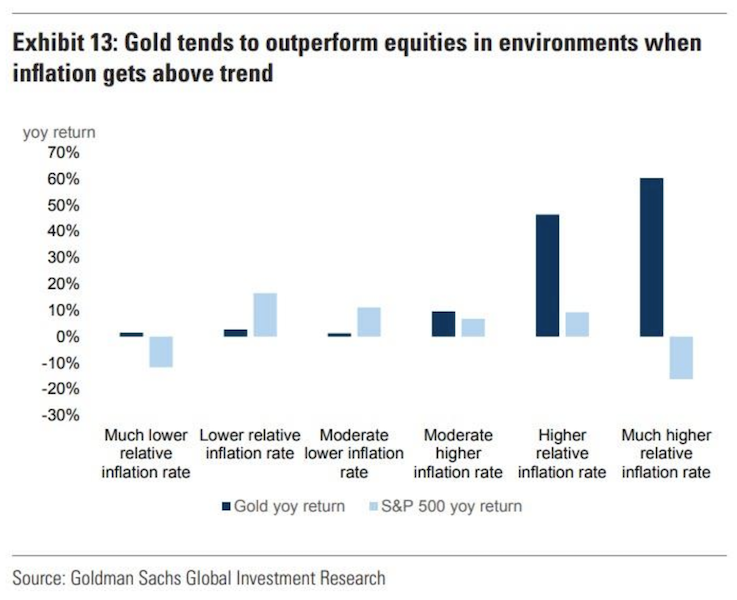
Equities do best in a moderate inflation environment. Inflation increases the odds of the central bank tightening monetary policy, which is bad for equities. Deflation tends to coincide with economic contractions, which is also bad for stocks. When equities do better, that reduces demand for gold among other assets.
Inflation expectations naturally vary over time. In the late 1970s and early 1980s, a 6 percent inflation rate in the US would seem tame. Today, it would be about 4x the magnitude of inflation expectations priced into markets indefinitely.
Gold’s return best correlates not through the absolute level but when it’s adjusted for its trend.
Goldman Sachs, in its recent report, uses an inflation argument as it pertains to the idea of a gold price of $3,000 per troy ounce (about 70 percent upside from mid-2020 levels):
Using this relationship between gold and inflation deviations from trend we find that to get to $3000/oz we would need to have inflation exceed its average over the past 10 years of 1.75% by about 3 standard deviations (approximately 4.5%). Alternatively, gold could reach $3000/oz if the move in inflation is smaller but more persistent. For example, an inflation rate of 3.5% maintained for several years would achieve a similar target. Persistently high inflation rates would lead to concerns over the commitment of central banks to meet their inflation targets, amplifying fears of inflation further.
But, an increase in interest rates in excess of the level of inflation, akin to Volcker’s 1980 policy, would remove any tail risks of inflation, reducing gold’s appeal.
They also looked at the performance of stocks and gold over prior inflationary environments.
The inflationary periods were broken up by looking at the deviation of year-over-year inflation rates against their rolling averages over the previous 10 years.
They found that gold did best when inflation surprised higher and outperformed during deflationary periods.
Protection against deflation
Gold is not only good in times of inflation, but during times of deflation, where it typically goes up moderately. These usually occur when business activity is reduced and debt servicing requirements compounded by drops in income create a fall in prices (both prices of financial assets and those of goods and services).
During these times, people are inclined to save more and keep their assets in cash. This can mean currency, short-term government debt, or a safe haven like gold.
At the same time, if people need cash to pay expenses or debts or need something highly liquid, that could also mean getting out of gold.
In the 1930s, gold was considered one of the best places to store wealth. It could be redeemed at any time for a fixed amount of currency. To get more liquidity in the economy to spur the recovery, President Roosevelt banished the ownership of gold through Executive Order 6102 in 1933.
Deflation tends to occur for short periods
Governments always target an inflation rate of at least zero because deflation can be damaging. A negative inflation rate/deflation typically means productive output isn’t being maximized.
If there’s deflation, it means the value of money increases over time, which incentivizes hoarding. That means less spending. One person’s spending is another’s income. So less income. And if less income, less spending, less productivity, and so on.
It’s hard to get an economy going if there’s deflation. So policymakers try to have at least a stable price level.
In the US they officially target an inflation rate of 2 percent (annualized increase). Low and stable.
Relatively stable gold supply
Since 2000, the global gold stock has increased by only about one percent per year. Money creation has gone up by a lot more. It will continue that trajectory with all the above-mentioned debt and debt-like flows coming due over time.
That means monetizations or defaults will be in store. Central banks will do anything they can to save the system and will inevitably opt for the former.
New gold mines can take up to a decade to bring to production. The supply side can be a driver of prices, though it doesn’t vary much from year to year. The demand side is a much bigger driver.
As of mid-2020, there were about 1.9 billion ounces in global gold reserves.
Estimated gold holdings by country (in ounces)
– United States: 300 million
– Germany: 120 million
– International Monetary Fund: 100 million
– Italy: 90 million
– France: 90 million
– China: 70 million
– Switzerland: 40 million
– Japan: 30 million
– Indian: 25 million
– Netherlands: 25 million
Geopolitical upheaval
Gold’s role is not only monetary or financial, but geopolitical.
If/when geopolitical tensions rise or there is less confidence in governments, gold is commonly sought after. Equities generally decline while safe bonds and safe havens increase in value.
Monetary policy’s effect on gold
Holding all else equal, the easing of monetary policy is bullish for gold denominated in that currency. The lowering of real interest rates decreases the return of interest-bearing currency and bonds, leading to the desire to find alternatives.
Moreover, in a world of low rates and exhausted traditional options (lowering short-term interest rates, purchases of financial assets), investors are gearing up for a return to other policies.
For example, the US Federal Reserve has not tapped yield curve control (YCC) since the post-World War II period. The basic idea of YCC is that it caps the yields on government bond yields to control borrowing costs. In other words, the Fed would buy an unlimited amount of debt should yields get up to a certain level.
World War II was a very expensive endeavor and YCC helped keep borrowing costs low. At the same time, if US medium-term yields are effectively controlled, then the market effectively loses an important benchmark that the rest of the investment universe is measured on.
Because of very high debt burdens relative to output, all of the world’s major central banks will not be raising interest rates for a very long time. The Fed announced until 2022, but it will be much longer.
Based on certain metrics like sum of inflation and the ratio of the employed relative to the overall population, there needs to be a big improvement before the economy is healthy enough.
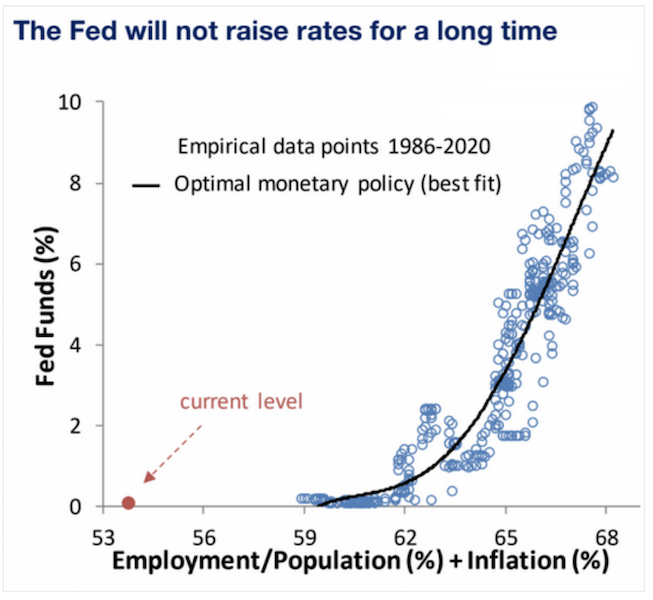
(Source: Piper Sandler)
This will remain a tailwind for gold.
Does M2 Signal an Increase in Gold Prices?
Some analysts use the M2 money supply to guide their predictions on gold prices.
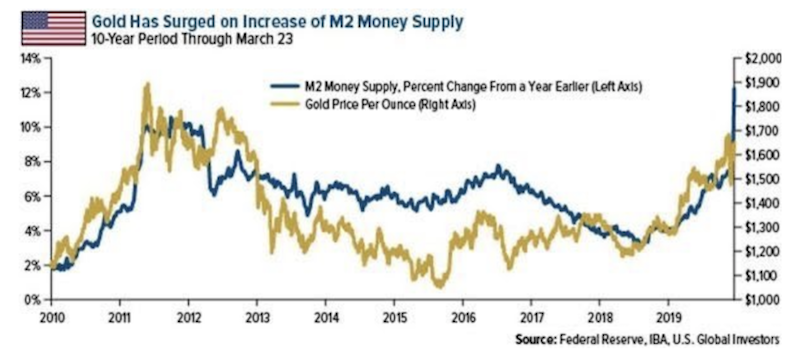
The thinking is that the more money you pump into the system, the more likely it is for gold prices to increase given gold is effectively the inverse of money.
The problem with M2 is that it conflates money and credit.
Money and credit are the basic sources of spending power but they are very different. Money is what you settle your payments with. Credit is a promise to pay. Credit is effectively a “short money” position. If you owe debt, eventually you have to cover it with money.
When analyzing technical flows like liquidity it’s important to separate the two.
M2 is predominantly a credit metric (about 80 percent of it in the US version of it), not a money metric.
For gold’s long-run valuation, “M0” (currency and reserves) is more relevant.
While credit expansion can signal the future need for more money to service debt (and therefore reduce the value of money and increase demand for alternative forms of money like gold), debt can also be defaulted on.
The historical cycle
More or less there’s commodity-based monetary systems and fiat currency systems.
There’s also a hybrid between the two. Some have bank notes backed by a commodity (usually gold and to a lesser extent silver). Whenever there’s a needed easing of monetary policy, the government can change the convertibility between gold and money. They can also abandon the use of gold altogether to have an unconstrained system, by which it would be a pure fiat system.
We’re in a fiat world currently and all reserve currencies are free floated. (Countries tied to the euro are in a quasi-peg system.)
But over time debt obligations build up that can never be serviced. People don’t want to be paid back in deprecated currency so they lose confidence in it.
Countries get out of their monetary problems by adopting a system with a very hard backing to it (typically gold and/or silver, but basically anything not subject to large swings in supply or demand). They then phase out the old currency.
Then the cycle starts again, but eventually money and credit creation is too restrictive under such systems, so they change the convertibility between currency and the quantity of the commodity or abandon the commodity system altogether.
We’re in the part of the cycle where interest rates are at zero in each of the main three reserve currencies (USD, EUR, JPY) and getting there in the world’s other major monetary/credit system (China), and also creating unprecedented amounts of money to relieve excessive debt burdens.
In the meantime, the exchange rates of these currencies can remain elevated relative to others because a) they need to print a lot to meet the demand for it so the currency is under-supplied relative to the demand and/or b) until defaults and restructurings set in, which reduce demand for currency.
The inflection points in currency regimes happen infrequently. Accordingly, because investors become accustomed to events they’ve experienced in the recent past, they tend to underestimate the likelihood of them occurring.
The last big inflection point for the US was in 1971 (half a century ago), when the US went from a gold-linked system to a pure fiat system. This led to a large rise in the price of gold relative to USD as more dollars were printed.
That these changes tend to occur is why smaller amounts of gold, other precious metals, commodities, and other hard assets are important to a portfolio and why I diversify among many different currencies and currency systems.
The main drawback of investing in gold
Even a well-established store-hold of wealth like gold, which has a track record going back millennia, has its own issues.
Gold is not a particularly deep market in terms of size. It is only about 3 percent of the size of global equities markets (about $100 trillion deep) and some 1-2 percent of the size of global debt markets (about $325 trillion deep).
It has limited capacity to take in large wealth transfers from more traditional asset markets as a consequence of this smaller size and its relative illiquidity.
However, it does function reasonably well as a reserve asset for smaller amounts of money. It will not always rise in a crisis that’s bad for stocks. But it will likely do well compared to equities on a relative basis.
Like any asset class, there is a time where it will perform well and a time when it will perform poorly in a portfolio.
Building a portfolio involves some level of diversification
Small amounts in gold is fine, but not a lot. There is no one asset that’s obviously better than everything else. Everything is currently priced based on market expectations (what’s known is already discounted in the price), so there are no easy good or bad bets.
If you put too much in any one asset and it implodes, then your portfolio and savings are in bad shape. You do, however, know that different assets will act differently from each other. So if you diversify well you don’t have too much to worry about.
Wealth isn’t so much destroyed in the world as it just shifts around. It’s always shifting between different assets, different countries, different currencies, and different stores of value.
When stocks go down, for example, it doesn’t mean the money disappeared. It means it just shifted somewhere else. If you have assets to catch that shift, you’ll be fine. If everything is in stocks, then you could be hurting.
Anyone who puts all their money into any given thing is making a very risky choice and will see many large drawdowns along the way.
Gold is simply like an alternative currency. It’s a type of cash that does well in a certain environment and terribly in other environments. It’s just a piece of a portfolio like everything else.
Will we ever have a return to a gold standard?
Everything goes in cycles.
The US was on the gold standard from 1944 (Bretton Woods System) until August 15, 1971 (and also before 1933, but was taken off because getting out of the Great Depression required the creation of new debt and money).
For the US in the 1960s, because of the liabilities that were being built up from social programs and the Vietnam War, the US debt started ballooning.
Back then, gold was a claim on money. You could go to a bank and use your paper money to get gold, priced at $35 per ounce back then.
But when the claims become too big relative to gold, then the conversion factor has to be changed (more dollars per each ounce of gold) or the tie has to be severed.
Policymakers don’t like gold standards because it inhibits money and credit creation. But when a government can print whatever it wants, it devalues this money and credit.
So it inevitably gets them into trouble because this privilege is abused because printing money and creating credit out of thin air is easy and gives a short-term pop. And the cycles involved in credit systems and currencies working well tend to last for decades while policymakers are only around for part of that.
When the devaluation becomes too significant then they have to tie their currency to a hard backing again (gold, sometimes silver, sometimes oil) to give it legitimacy again.
And the cycle repeats. The inflection points in these cycles are reached infrequently, so people are usually surprised when they happen.
Conclusion
Gold has been part of monetary history since at least 800 BC. People have placed value into gold and has been interwoven in culture and society for thousands of years.
Though economics courses haven’t cover gold to much of an extent such the US went off the gold standard in 1971, it remains an important reserve asset. It remains under-owned by many investors. Because stocks have done relatively well since the financial crisis, people stick to what’s done well and underemphasize other asset classes.
With developed economies in difficult forward situations financially, gold is likely to play more of a role going forward. Nominal interest rates are at zero or negative throughout the developed world. Real rates are negative.
With cash not yielding anything, that means more of a place for alternative stores of wealth looking ahead. Gold is the primary asset economies revert to as a backing of currency when fiat currencies lose their value.
It acts as a form of diversification to different currency systems that we cycle through throughout history.
In one’s portfolio, having gold at about 10 percent of the overall allocation could be a reasonable target.