Financial Market Forecasts: Recent Performance


To start, this is not an article on this year’s annual outlook. We have a piece on intermediate-term financial asset performance (out 5-10 years) and others about navigating the upcoming decades, broken up into a Part I and Part II.
Every decade tends to have a different flavor to it in terms of what asset class or strategy does best in the markets. It’s not of course specific to each decade, but each period of time is characterized by different conditions that create different performances in different asset classes.
Instead, we are looking at financial market forecasts from the very recent past – 2018 and 2019. Forecasting is hard and often simply serves as marketing material for the firm that releases them. Moreover, it’s easy to criticize prior forecasts because what ended up transpiring always seems obvious once it’s occurred.
Nonetheless, even given how difficult forecasting future asset prices is and as unavailing as predicting the future is, forecasts can still have value for traders and investors. The dollar-weighted opinion is already priced into the market for each asset, so understanding what people think is important.
While tactical betting is difficult – namely, moving in and out of markets trying to predict what’s good and what’s bad and what direction it’ll go – if you do choose to go that route (rather than having well-diversified strategic exposure), you’ll need to know what’s already baked into the price and see how that opinion compares to your own. To do well trading tactically, you need to have an independent opinion and be right because the consensus is already in the price.
We know that Microsoft, Google, Apple, and Facebook are very successful companies that produce a lot of cash flow, but their market valuations are a product of the present value of future discounted expectations.
The market is just as likely to discount high growth as too high or too low relative to low growth.
For this reason, despite your vast menu of opportunities on what securities you can put your money on, almost everything is an equally good or bad bet because of how pricing already reflects what’s known. It’s no different than the handicapping process in sports betting.
It’s not hard to predict which teams are going to win most of the time, just like it’s not hard to predict which companies are going to grow more or produce higher earnings than others.
It is, however, hard to convert this knowledge into winning bets because of how prices already take into account this information and the distribution of future outcomes is typically much higher than what’s already known. Due to other matters, such as commissions and spreads, it is hard to beat a representative index over time.
That’s why the stock market is more volatile than short-term sovereign debt markets. You know that if you invest in a two-year government bond from the US, Germany, UK, Japan, among other highly creditworthy countries, you know what interest rate you’re going to get (maybe none in this day and age, unfortunately) and when you’re going to get it. Accordingly, there is little fluctuation in the prices of these instruments. However, because the cash flows of equities are theoretically perpetual, and there is a large uncertainty surrounding how it plays out, there is a much wider swing in the price action.
The same could be said of gold. It is not a cash-producing instrument so its price is not based on direct cash flow metrics. Getting at the main sources of demand, gold is primarily used as a reserve asset by central banks and as a currency hedge when real interest rates become unacceptably low. Because the gold market is quite small and illiquid – about $3 trillion versus nearly $300 trillion for global debt markets and a bit over $100 trillion for global equity markets – any flow of money into such a market can really swing its price.
The moral of the story is that, yes, forecasting the markets is hard to do and most are quite bad at it, but getting at what the market already discounts and the nature of the market and what drives its price is important.
Investors also use forecasts of future likely returns (and future risks) into their asset allocation decision-making.
Forecasts: Looking at both numbers and words
Looking back at economy and market forecasts from 2018 and 2019 among economists at large financial institutions, there are usually both quantitative and qualitative components. There are predictions that forecast prices, percentage growth, and so on, and then there are word-based forecasts that can be parsed via language processing algorithms to understand direction and with respect to the type of asset, asset class, economy, and so forth.
Some financial analysts naturally talk out of both sides of their mouth or hinge their “prediction” on a self-evident caveat (e.g., if earnings increase above expectation, stocks are likely to go up). Such forecasts that don’t contain any actual market views were omitted.
Overall views on markets
Over the 2018-19 period, most forecasts were bearish on government bonds and corporate credit. They were bullish on commodities and net bullish on equities (“net” meaning there’s a wide range of opinions on various stocks).
Most analysts are bullish on equities. Sell-side equity research is predominantly a de facto marketing division for the associated investment bank. Companies tend to not be inclined to do business with a bank that sends out unflattering opinions about them to the public.
Investment bankers need quality relationships with management teams to win underwriting business and for other corporate initiatives. “Bad” reports from the equity research department don’t help. However, sell-side researchers need to strike some balance between “strategic bullishness” (for the benefit of their in-house bankers) and credibility for the benefit of their institutional clients who rely on them for information regarding the companies they cover.
Overall views on the economy
Mentions of “late cycle” were common, referencing the idea that unemployment was low and that output was growing close to capacity. This also, in typical business cycles, generally stimulates inflation as workers generate bargaining power for higher wages. So, central banks try to “cool off” the economy by hiking interest rates.
This is what was happening in 2018 and some expected this to continue into 2019 (as did central bankers). But the stock market had a meltdown at the end of 2018 when the central bank tried to hike rates even somewhat modestly, which was a byproduct of the high indebtedness of the economy relative to income.
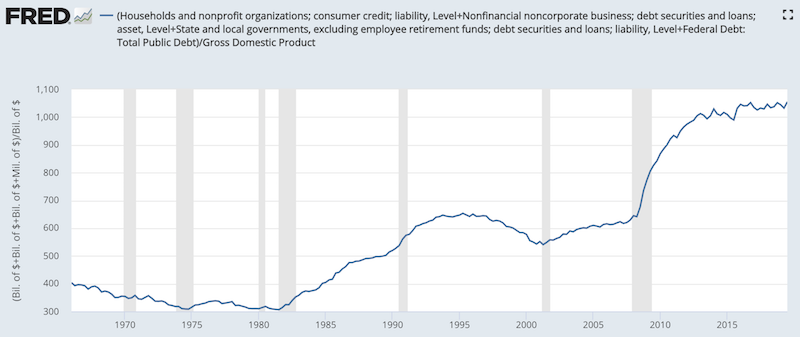
(Source: Federal Reserve)
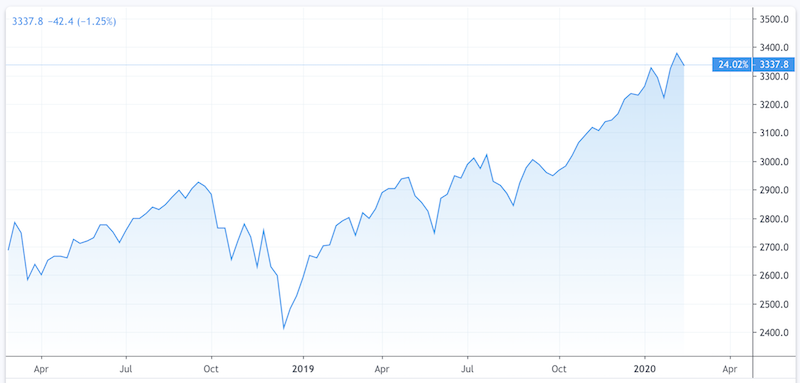
The Fed walked back on its intentions at the end of 2018, leading to a V-shaped recovery in the stock market visible in the center-left part of the graph below. This 20 percent drop in Q4 2018 led to a 30 percent return for the S&P 500 in 2019. Despite the recent strong performance of stocks, it’s up a more normal 24 percent over the past two years.
Few analysts predicted a recession. Many predicted weak earnings and cited higher inflation expectations associated with a late cycle economy for the bearish predictions on government bonds and corporate credit.
The most bullish stock calls were on “defensive” equities. These include stocks that aren’t as cyclical, such as consumer staples and utilities – companies that sell products and services that are needed by people, companies, and governments regardless of what the economy is doing.
At the end of 2018, this prediction made sense. The stock market had its worst performance since 2008, the Federal Reserve hiked rates four times, which had also caused a sell-off in bonds and credit. They expected another 2-3 hikes in 2019 per the projections they release publicly. Many feared the Fed would break the economy after it had already broken the equity markets by causing a 20 percent decline.
Because of the uncertainty regarding whether the Fed would backtrack on what it had done and intended to do, and whether it was already “too late”, it was more difficult in this type of environment to for analysts to give bullish recommendations on stocks. Any bullish equity positioning was typically geared toward defensive allocations.
The Fed did, of course, walk back on its intentions and flipped to rate cuts. This caused a big year for stocks in 2019, though two-thirds of the rise was simply doing the damage from the final quarter of 2018.
Government bonds were also up in 2019, which flowed through into corporate credit. As a whole, forecasts did not get this right. Because markets are priced based on forward expectations, and few expected the central bank mindset to turn as it did, returns were beyond what was expected.
US GDP grew at a 2.9 percent annualized pace in 2018. Most forecasters expected 2019 growth to be lower due to the pass-through of the fiscal stimulus signed into law in late 2017 and because of the tightening in financial conditions due to the increase in rates.
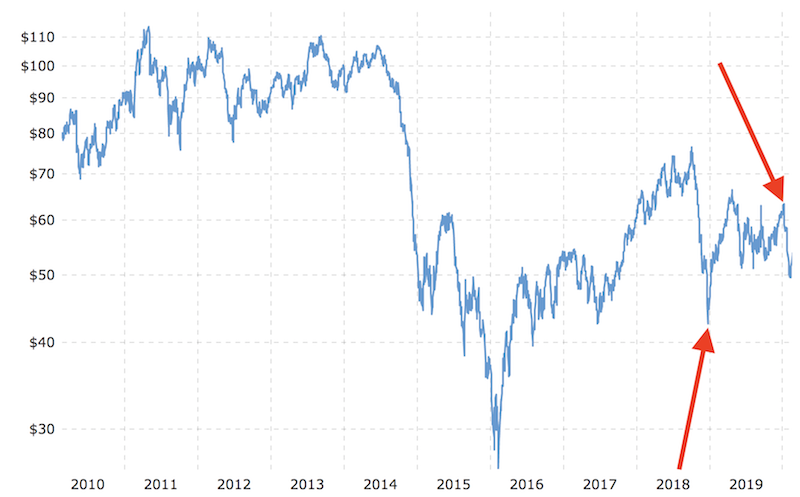
Growth in 2019 was slower, coming in at 2.2 percent. The bullish calls on commodities were mostly correct. Energy had a good year overall in 2019, but mostly because of fortuitous timing of where the start and end of the year fell (below-$45 to above-$60).
Inflation also increased a bit, but remained right around two percent. It didn’t get into a range where the Fed will consider tightening rates again, and has to once again attempt to strike the delicate balance between avoiding excess inflationary pressure and keeping economic output growing. Getting this wrong is why we typically have recessions.
Basically, economic forecasters were quite off on the markets but right on the economy.
Naturally, this should be the case. It’s not an overly difficult to task to forecast where growth and inflation will go within the next year within a reasonable band. The markets are more difficult because it’s not whether things are “good” or “bad” but rather whether things are “good” or “bad” relative to what’s already discounted into the price.
This is how a good year for the economy (2018) led to one of the poorest overall years for financial asset prices on record (taking into account stocks, bonds, credit).
Based on data compiled by Deutsche Bank, going all the way back to records kept from 1901, 2018 was the worst year for financial asset prices measured by the percentage of assets that had negative returns (93).
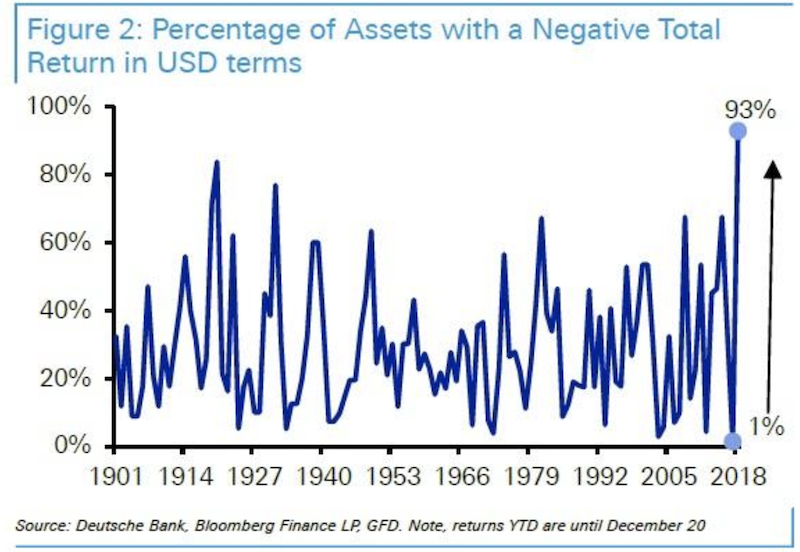
Cash was the best performing asset. But capitalist economies can’t perform well over the long-term if cash returns better than financial assets. It means goods and services – the things off which financial assets are a claim – aren’t being efficiently produced. Over the long-run, money needs to flow from cash to financial assets.
The Fed recognized it was overly tight, which led to a U-turn in financial assets in 2019.
We see this with all previous scenarios as well. The excessively tight monetary policy in the US in 1982, 1994, and 2018 all led to notable rebounds in the returns of financial assets in the years following – 1983, 1995, and 2019.
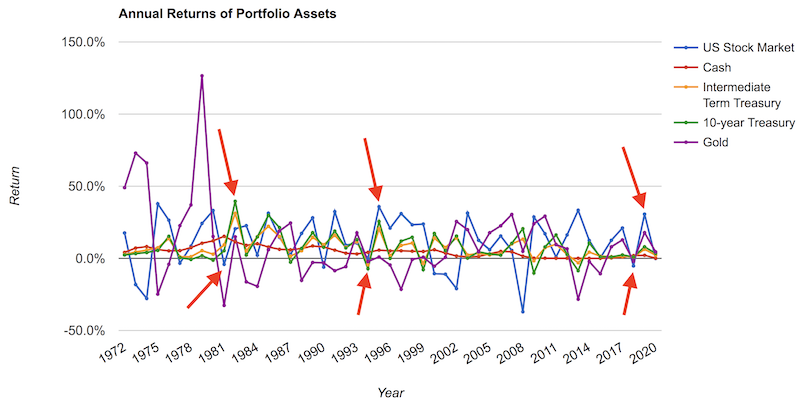
This is why mixing assets well and having balance will greatly limit your tail risk and lead to low drawdowns and very few down years compared to having concentration in a particular asset class.
Most people concentrate their portfolios to be long equities, where their risk is based on the idea of the stock market holding up. Balanced portfolios will have their risk concentrated in the idea of whether the portfolio will outperform cash, and you can feel pretty comfortable with this risk.
Even if you look at the chart above, in 2008, a once-a-century type of debt crisis that hit the stock market more than 50 percent peak to trough, other asset classes included in the diagram all had positive returns – cash, government bonds of various durations, and gold.
A debt crisis is a particularly bad environment for stocks, but can be neutral to good for other types of asset classes. Most lost a lot of money in 2008 because they had a bias toward being long risk assets, and were overextended in them, not just directionally but through the use of leverage.
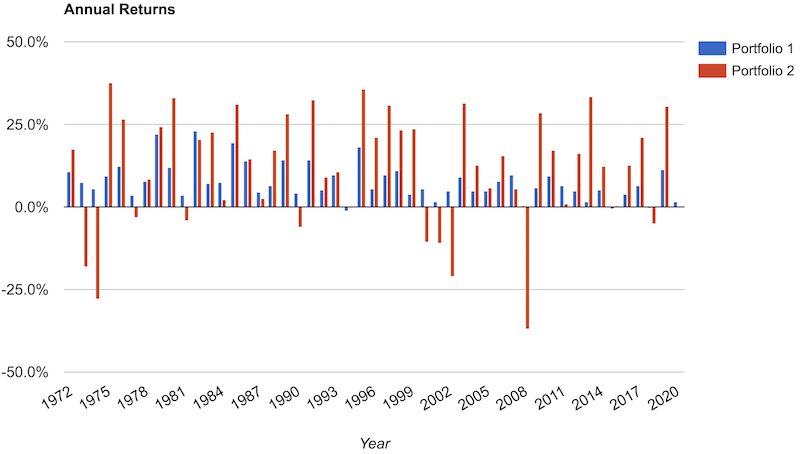
A portfolio that was broken down 20% stocks, 30% cash, 20% intermediate Treasuries, 20% 10-year Treasuries, and 10% gold would have made money (barely) in 2008. The blue bars represent the annual returns of this simple allocation since 1972 and the red bars represent a 100% allocation to stocks over this time:
A balanced portfolio produces drawdowns that are much more tolerable and conducive to compounding more efficiently over the long-run:
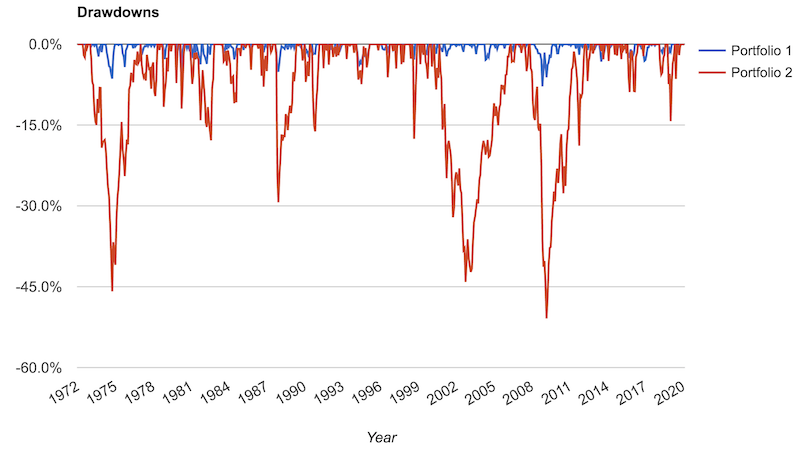
If this mix were leveraged to match the volatility of equities (it has just 32 percent of the volatility of equities), it would have returned 14.7 percent annualized (taking into account the funding costs at the average cash rate of 4.75 percent over this time). This compares to a 10.4 percent annualized return for equities.
It would have not only produced a higher return, but had a maximum drawdown of 24.5 percent versus 50.9 percent for equities.
Forecasters’ tendency to extrapolate forward returns
Because 2019 and the start of 2020 have been a great period for the stock market and almost all major asset classes, analysts feel comfortable being more optimistic about their returns projections.
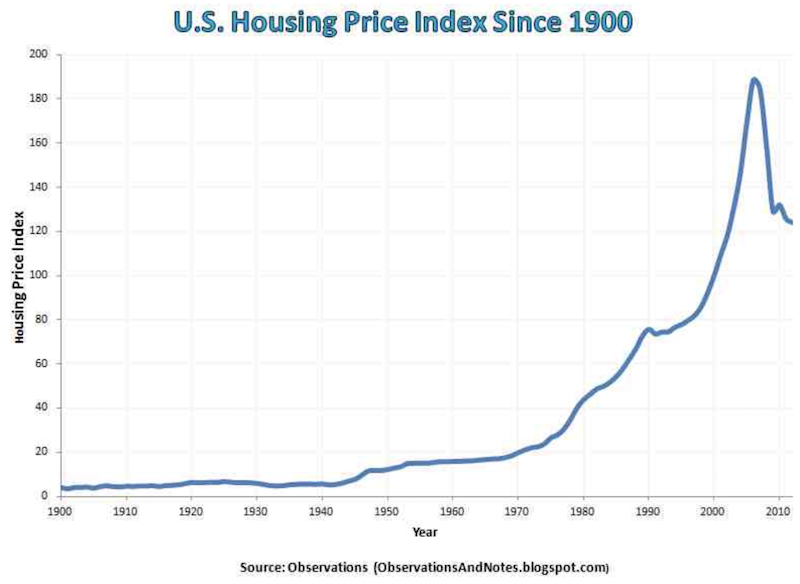
It’s a natural tendency to get accustomed to what we’re used to and assume that such conditions will continue going forward. For example, if you looked at a chart of home prices from 1900 to 2007, you might have thought that they were a nearly infallible investment.
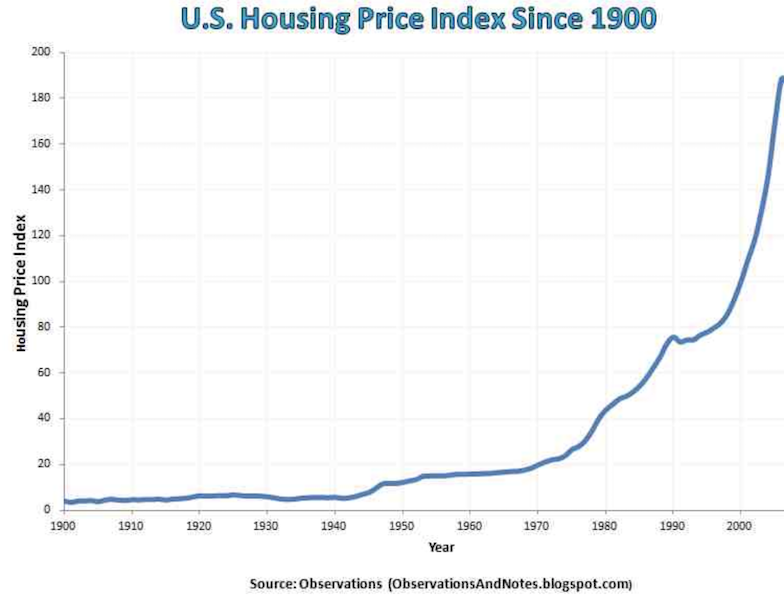
But they went skyward based on lending and leveraging practices that were not sustainable. Any financial asset, including houses, are worth what the present value of the future cash flows are worth. If not enough cash is thrown off by the asset, then prices at some point will contract.
Eventually a bunch of debt came due that couldn’t be repaid and this happened:
Most expect favorable returns for the stock market looking ahead. There are always people that are perpetually pessimistic. Zero Hedge, for example, has gotten very popular based on its incessantly negative slant on financial news (“good news doesn’t sell”).
Forecasters are mildly optimistic on government bonds and corporate credit.
As a whole, analysts are more bullish on riskier forms of assets in comparison to safe ones. This may have to do with the strong positive returns from last year or because stocks tend to go up over time. Likely it has more to do with the latter.
Inflation expectations are low and more are positive on economic growth.
In terms of breakeven inflation expectations baked into markets, they are also materially lower in 2020 than they were in 2018:
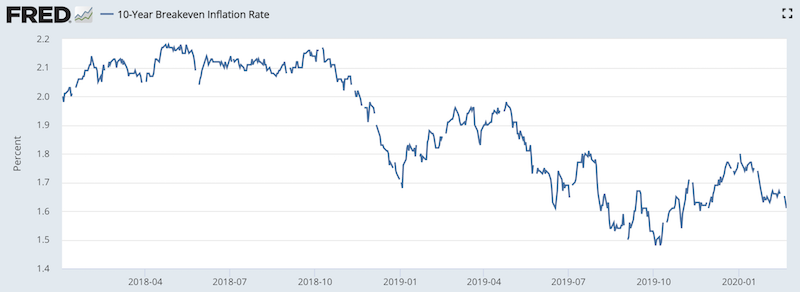
(Source: Federal Reserve Bank of St. Louis)
What financial market forecasts are truly indicative of
Events that have recently transpired color one’s expectations of the future. This is why markets are so difficult for the average investor and why they underperform them. When things are great, people become more comfortable taking risk, causing many to buy toward the higher. When things are bad, people become more fearful, or they get caught overextended and need cash. This causes people to sell toward the lows.
The Peter Lynch Magellan Fund, which produced approximately 29 percent annualized returns from 1977 to 1990, actually lost money for the average investor. Anybody who had owned it over the entire time – with no additional contribution – over those 13 to 14 years would have returned about 28x their money.
It’s easier to market investment products when they’ve done well in the recent past and much harder when they’ve done poorly. Many people bail when they have the inevitable down patch.
This is another reason why traders and other investment managers need to manage their drawdowns if they take in outside capital. People have a tendency to put money on a “hot hand”. Managers that have downswings that are typical for the stock market – 20 percent or more – are unlikely to be able to keep investors’ money. Those that run more volatile strategies are likely to want longer lock-up periods.
Financial market forecasts are more indicative of the past than they are of the future. They are framed on the basis of recent events, though trading well in a tactical sense is about knowing what the future will hold relative to what’s already discounted into markets.
Most traders are best off probably ignoring them. There are also some things in the markets you either want to avoid or, if it’s your thing, actively bet against.
Some will often suggest to do the opposite of what the “experts” predict. While you need to have a unique or out-of-consensus view (and be right) to make money in the markets if you’re going to actively trade, it is too radical to simply “do the opposite”.
Even if forecasts are tied to the past, they also flow into market pricing. Moreover, forecasts follow some of the same behavior seen in markets. Once they start trending in one direction they tend to continue going in that direction.
Moreover, even though the annual forecasts that banks and other institutions put out in November to December for the next year are often not accurate in retrospect, that doesn’t mean their opinions remain the same. This is the danger associated with anyone giving tactical recommendations on what to buy or sell or what to do in the markets more generally. Things change and this may require changing positions in your portfolio.
For example, in late-2018 the average inflation forecast was too high relative what transpired, but was continually decreased throughout the year. This helped turn the Fed into an easing bias, which provided a tailwind for equities and bonds.
Overall, financial market forecasts can be used as input to back out market pricing and as an indicator of which way the wind is blowing currently. When a stock goes up, you’ll often see investment banks upgrade shares (e.g., from neutral to buy) and increase their price targets. This helps goose share prices further, often leading to a conspicuous trend. But they should not be used to position a portfolio to overemphasize any particular theme.