How the Game Monopoly Can Help You Beat the Markets


Markets and economies work in what are called cycles, or in a series of logically-driven patterns. In capitalist economies, which is most of the world, expansions and contractions in credit are what drive economic and market cycles. The game Monopoly is a useful analogy to apply to the broader economy. If you understand how Monopoly works you can pretty well understand how markets and economies expand and contract as time goes on.
The beginning
At the beginning of the game, you want to own property because you have a lot of cash and therefore property is cheap by comparison. This is analogous to downturns in the economy and markets, where there are a lot of assets for sale and central banks push cash and credit into the economy – traditionally through the lowering of interest rates and buying financial assets (i.e., sellers of these assets receive cash to go spend on other assets). Or similar to when countries are first coming up in the world and cash is coming in and ready to seize available investment opportunities.
Low asset values give them a high risk premium relative to cash. So, the incentive is for people to buy financial assets and other things that’ll provide cash flow, like real estate and equity-like assets (e.g., private businesses, land in its various forms).
Early on in Monopoly, players have a lot of cash and not many properties. So, it makes sense for participants to want to convert their cash into property until they get to the mid-game. This is the point at which most property is bid up, monopolies are established (owning the 2-3 properties per color group, which then allows for the “building” of houses and hotels to increase the rents on which the building occurs).
The mid-game
As the game goes on, most of the property is bought, and players begin increasing the value of their assets by buying houses and hotels. When this starts to occur, cash becomes more important as landing on such high-value properties carries large rent costs.
At this point, not only is more cash is needed to pay the debts coming due (i.e., the rents charged) but liquidity is getting harder to come by. In the real economy, the central bank is usually less apt to provide accommodative policy late in the cycle as it attempts to prevent excesses, like inflation and excess speculation.
When a player lands on a property that comes with a steep rent, there will come a time where they are short of cash and need to sell their property at a discount to raise the cash necessary. Some players will be able to buy up these “distressed” assets at a discount and become more dominant. Some players will go broke.
The end-game
Cracks, even if they’re initially localized and one-off at first, start to appear but will become a bigger problem for certain players if they don’t have sufficient cash. Like in the real economy, if there’s not enough liquidity, eventually too much debt comes due and people blow up because they can’t service it. When people need cash, they sell their assets, often at a discount.
Toward the end of the game, you want to strike the right balance between cash and property, as everybody becomes “fully invested”. As cash becomes scarcer and players are less liquid, prices as a whole aren’t likely to increase much.
As the natural arc of the game progresses, you want to go from buying property (and continue building) to ensuring that you can pay rents as other players build by properly assessing risk and reward.
Like in the markets, having your pulse on risk premiums – i.e., what’s the percentage return difference between cash and bonds, or cash and stocks – and the liquidity picture (are central banks easing, tightening) is important in order to be able to play the game well.
How Monopoly differs from the real economy
Monopoly differs from a perfect model for real-life in that the game represents a type of cash-only economy.
If the bank were allowed to make loans and players were allowed to buy and sell properties to each other on credit, it would be a very good representation of how the economy and markets work in real-life.
The amount of spending on houses and hotels would grow to many multiples of the amount of money in circulation, much like how it works in the real world.
If the wrinkle of being able to buy properties on credit was added, the progression of the aggregate values of the properties in the game would look a lot like the stock market. Mostly a slow rise up as cash moves into assets and sharp surgical turns down when the credit cycle turns.
Eventually, under this format, the people owing money on these houses and hotels will fall short on the cash they need to pay rents and service the debt. Moreover, the bank would run into issues when players’ increasing need for cash causes them to withdraw it at the same time people are struggling to meet their debt payments and falling behind.
If extra liquidity isn’t added (the central bank’s role in the real economy), both banks and debtors will go under and economic activity will contract.
As time goes on, as these cycles are repeated, the debt to income ratio doesn’t typically decline much during contractions. Policymakers are incentivized to do what they can to save the economy, and will practically do anything (including buying poor-quality collateral) to save entities they deem are worth saving to achieve their objectives.
Over the past 50+ years in the US, we can see debt to output ratios getting larger over time.
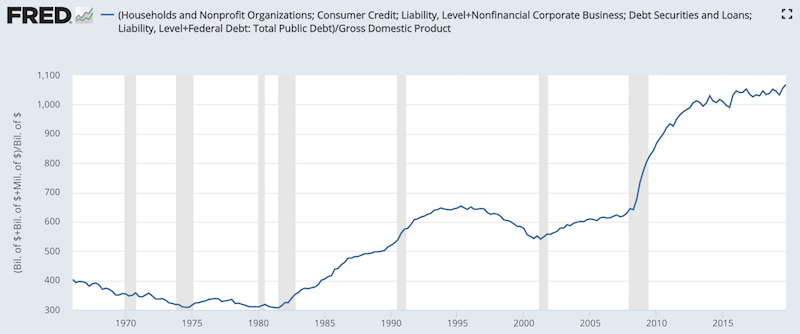
(Sources: BEA, Board of Governors, Treasury)
This also means the central bank has limited capacity to raise rates without triggering higher debt service requirements and another downturn.
Debt cycle patterns
The patterns of debt cycles are similar, though how events unfold or how long each takes will differ from cycle to cycle. Just as a game of monopoly evolves at different rates, the way it eventually unfolds is the same, as players inevitably become overextended. Monopoly is not a perfect example of the economy and markets due to its cash-only nature, but largely follows the same template.
Simply put, any time money is borrowed, a cycle is created. Buying something on credit means not finalizing the transaction. An IOU is created. It eventually needs to be paid back.
Not only does it involve borrowing from a lender, it also involves borrowing against your future earnings. In other words, at a future point in time it will require spending less in order to pay it back.
The process of borrowing, spending more than your income, and then having to spend less at a point in the future will start to resemble a cycle, or a series of events that are both mechanistic and predictable. It’s true for any level of an economy, an individual, corporation, or a government.
Self-sustaining movements
Lending creates upward movements in economic activity and financial markets that eventually produce reverse movements. Each is self-reinforcing, as can be observed from look at market price movements over time.
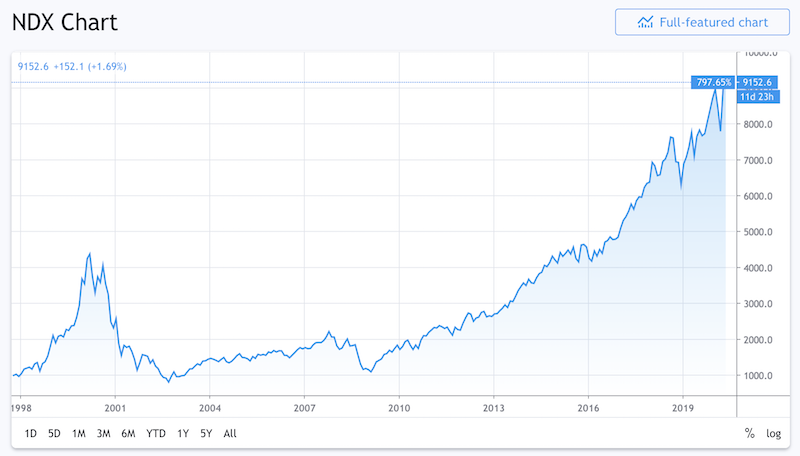
(Source: tradingview.com)
The movements are self-reinforcing because they create more of the same activity.
During the upswings, lending provides spending power. This boosts investment, asset values, and incomes. This makes collateral worth more, which promotes further lending and spending on goods, services, and financial assets, in a self-sustaining feedback loop.
But this borrowing gets to a point where it boosts spending and incomes above the level of productivity in an economy. The reason why cycles and economic problems occur is fundamentally due to incomes rising above productivity and debt rising above incomes.
At a point, lending is made based on the expectations that this above-trend growth will continue on, essentially extrapolating conditions that are unsustainable.
Eventually the level of income will fall below the cost of the borrowing, and income won’t keep up with the debt servicing requirements.
Levels of cyclicality
Some economies are more cyclical than others.
Emerging market economies tend to have bigger moves up and down than more mature economies. Their growth, as they rise in influence, is generally fueled by purchasing of infrastructure, real estate, and other forms of fixed investments made on credit.
The rates of spending on these long-lived fixed assets is not sustainable. At a point, they will be built and the incremental need to spend on them will decrease.
Once that spending on those fixed assets goes down, so will its impact on economic activity. Demand, growth, income, and debt servicing will shift to other forms of demand.
If a country is spending $100 million per year to build a subway system – workers, machinery, concrete, steel, etc. – when the system is finished, the spending on materials and labor will fall to zero.
At this point (completion), it will absorb different types of costs related to new workers to operate the trains, tracks, and other elements vital to the system’s function. Customers will be needed to provide income and pay off the debt used to finance its purchase and help cover the new types of costs associated with its operation.
Emerging markets typically have big boom and bust cycles because of how much building they need to complete and they’re subject to this dynamic.
Moreover, as the incomes of rising emerging market countries rise, their labor becomes less competitive internationally. Naturally, this makes their goods more expensive on the export market and they usually shift their economies to more of a services and consumption-based model.
At the beginning, they usually have little infrastructure (or bad infrastructure) and cheap workers. Accordingly, they build infrastructure, become exporters by selling finished goods and/or resources, and this attracts in foreign capital and investment looking to produce cheaply or capture an increasingly wealthy market. Incomes rise.
But export growth slows as their incomes rise and the competitiveness of their wages declines relative to other countries. There are many examples of this, such as Japan after World War II and China since they began opening up their economy, starting in 1982 and more forcefully in the early 1990s.
Bubble and the ‘the top’
When bubbles develop, it is a combination of a) imprudent lending behavior resulting in a large amount of bad loans and b) an impractical extrapolation of current conditions.
The typical sign that an economy or market is in a bubble is when more money is being borrowed to service their debt. This means income is not being used to pay off debt, like in cases of “good debt” where the cash flows produced from the investment are larger than the debt service costs. Instead, it’s transformed into “bad debt” where more of it needs to be taken on to pay it off. This worsens the debtors’ financial situations.
Policymakers eventually figure out this is going on at a pervasive enough scale and realize that it’s a dangerous and unsustainable situation.
At some point, central bankers want to rein in money and credit growth and/or impose higher lending standards by tightening monetary policy. This causes more debt problems to emerge and this is the point at which economies will start contracting and markets will typically top sometime before the economy.
The bursting bubble
Central banks raising rates or pulling back on other policy measures (e.g., halting asset purchases), typically speeds up the decline, though it would eventually happen anyway. Fundamentally what matters is that the costs of debt servicing are larger than what can be borrowed to finance spending. When this occurs, the upward move goes the other way.
It becomes self-reinforcing on the way down as lending decreases and it’s more difficult for borrowers to make the debt payments. When it becomes clear that borrowers are struggling, lenders also pull back. This contracts spending and investment, and incomes and asset prices decline.
Moreover, when debtors cannot meet their debt service requirements to their lenders, these lending institutions also cannot make due on their obligations to their creditors.
Which entities are most at risk?
The most pressured institutions are those that are both highly leveraged and have the most concentrated exposure to distressed borrowers. They are also at risk of creating issues for other creditworthy entities and bringing down overall economic activity. These are traditionally the commercial banks, but also include other lending institutions as well that are outside of the traditional regulations and/or are subject to different regulatory frameworks, such as non-bank lenders, insurance companies, broker-dealers, hedge funds, proprietary trading shops, and special purposes entities.
Final Thoughts
Debt cycles usually produce a couple main problems over the long-run:
i) There are the losses generated from debt servicing running below expectations. One person’s debt are another’s assets. When debt isn’t paid, then the asset a person believed they had really isn’t there.
During debt crises (e.g., 2008, 2020), it either results in smaller payments (that may be paid irregularly) or the debt may be written down by some amount.
The creditor may accept a different payment schedule, it may extend the maturities, it might lower the interest rates, it might change whose balance sheet it’s on, or it might simply realize that taking less is better than getting nothing.
ii) Even after debt crises have been resolved, the level of borrowing and spending by the entities that were most stressed by the scenario is unlikely to return to normal.