Trading Chinese Yuan (CNH)


The CNH (offshore renminbi) and CNY (onshore renminbi) are two versions of China’s currency. CNH is traded outside mainland China in financial hubs like Hong Kong, is subject to fewer regulatory controls, and has an exchange rate determined by market forces.
CNH is more accessible to international investors and has higher liquidity in global markets, making it suitable for large-scale transactions and day trading.
This guide will help you understand the CNH and how to trade this Chinese currency. We will walk through a firsthand trade scenario and reveal the best brokers for trading the Yuan.
Quick Introduction
- China’s currency exists in two forms: CNH (offshore) and CNY (onshore). On many forex trading platforms, you can trade USD/CNH but not USD/CNY.
- Trading CNH is attractive because it combines accessibility, liquidity, market-driven pricing, diversification, and accessibility to the Chinese economy, one of the largest and fastest-growing in the world.
- Monetary policy actions by the People’s Bank of China (PBoC), such as changes in interest rates, can significantly affect CNH.
Best Brokers For Renminbi Trading
Our latest tests point to these 2 brokers as the best for trading CNH:

Understanding The Yuan
The official currency of China is the yuan renminbi (CNY), which translates to ‘people’s currency’ in simplified Chinese.
While ‘renminbi’ refers to the currency’s name, ‘yuan’ is its basic unit. Both are represented by the symbol ¥, which can sometimes lead to confusion with the Japanese yen (JPY). The abbreviation CN¥ is occasionally used to avoid this.
Introduced in 1948, the renminbi is commonly abbreviated as RMB, though this is not an official currency code. In offshore markets like Hong Kong, where the yuan trades freely, the unofficial code CNH is used.
Despite not being the world’s most-traded currency (ranking eighth), the renminbi has become a significant reserve currency held by central banks globally.
China’s economic power has fuelled speculation that the yuan could eventually challenge the US dollar’s position as the world’s primary reserve currency.
However, the US dollar currently maintains a dominant role: it accounts for 62% of global foreign exchange reserves, 62% of international debt, 57% of global import invoicing, 43% of foreign exchange turnover, and 39% of global payments.
This vast difference highlights the yuan’s significant journey before achieving similar global integration. Nevertheless, its potential rise reflects China’s growing influence in the world economy.
Why Trade The CNH?
CNH presents several compelling trading opportunities:
- CNH trading offers accessibility and liquidity in the international markets. This greater accessibility attracts a broader range of global participants, including financial institutions, hedge funds, and multinational corporations. This, in turn, enhances liquidity and makes it easier for traders to enter and exit positions efficiently.
- CNH is highly responsive to market forces, providing more opportunities for traders to capitalize on fluctuations arising from economic data releases, geopolitical developments, and shifts in market sentiment. The volatility of this market responsiveness can be particularly advantageous for day traders looking to exploit quick price movements.
- Trading CNH offers a way to gain exposure to the Chinese economy, among the fastest-growing globally. As China continues to play a crucial role in global trade and investment, movements in the CNH can offer insights into broader economic trends and provide opportunities to profit from China’s economic trajectory.
How To Start Trading The CNH
Trading the CNH involves buying and selling currency pairs in the foreign exchange market, such as USD/CNH (US dollar/Chinese yuan), EUR/CNH (euro/Chinese yuan), and CNH/JPY (Chinese yuan/Japanese yen) to profit from price changes.
To start trading CNH, you’ll need to:
- Open an account with a forex broker – we recommend choosing a forex broker authorized by a ‘green tier’ regulator.
- Deposit funds – consider opting for a broker that supports your local account currency to minimize conversion fees.
- Execute trades – your broker will provide a desktop, mobile, and/or web-based platform.
What Moves The CNH?
The value of CNH is influenced by a combination of economic indicators, monetary policy, trade relations, global market sentiment, movements in the US dollar, capital flows, speculative activities, government policies, and international economic conditions.
- Economic indicators such as China’s GDP growth, inflation rates, industrial production, and retail sales play a crucial role. Stronger-than-expected economic performance typically leads to the appreciation of CNH, while weaker data can cause depreciation. Employment data and other indicators reflecting the health of China’s economy also contribute to the currency’s movements.
- Monetary policy actions by the PBoC significantly affect CNH. Changes in interest rates, reserve requirements, and other economic tools can influence trader sentiment and the currency’s value.
- Trade relations are critical, particularly between China and major trading partners like the United States. Positive trade developments and surplus trade balances strengthen CNH, while trade tensions and deficits can weaken it.
- Global market sentiment and movements in the US dollar also affect CNH. In times of global uncertainty or risk aversion, CNH may weaken as traders seek safe-haven assets like the USD, JPY, or CHF. Conversely, a weaker USD typically leads to a stronger CNH.
- Capital flows, including foreign direct investment and portfolio investments in Chinese equities and bonds, influence CNH demand. Based on market expectations and news, speculative activities, and hedge fund trading can cause short-term volatility.
Example Trade
This scenario demonstrates a day trading strategy for the USD/CNH currency pair.
Event Background
I closely monitored my economic calendar for any major announcements that could impact the USD/CNH currency pair.
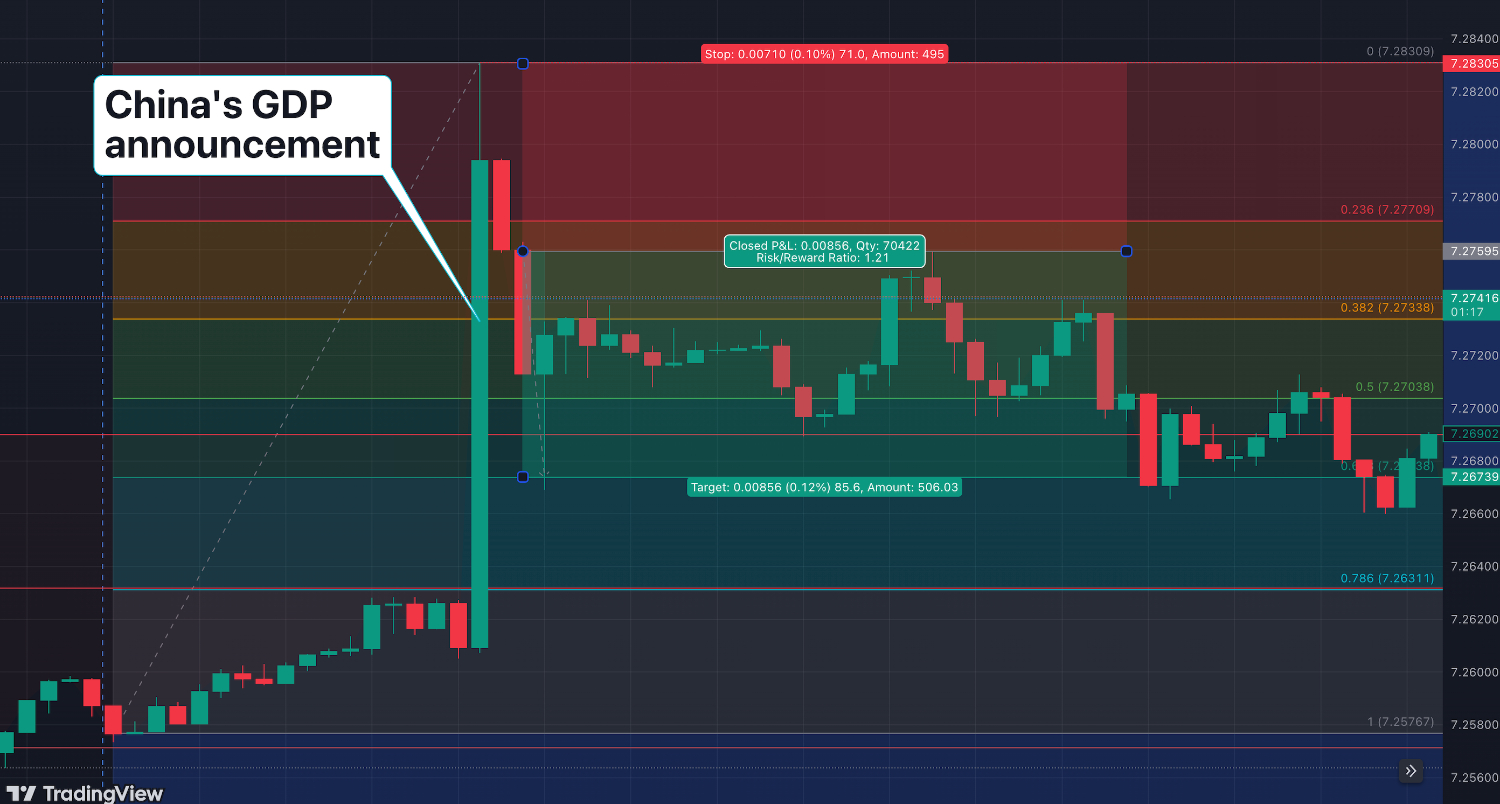
One of the most anticipated events was the release of China’s quarterly GDP growth figures. Market analysts were expecting a moderate increase in GDP, reflecting a steady but not overly robust economic recovery.
The announcement was scheduled in the morning, Hong Kong time, which didn’t coincide with my regular trading hours, but I decided to trade this opportunity.
Interpretation Of Data
On the day of the announcement, I was up late to review my charts and news feeds. As soon as the data was released, it showed that China’s GDP growth had significantly exceeded expectations, at 5.3% compared to the forecasted 4.8%.
This stronger-than-expected economic performance indicated a healthier economy, which typically strengthens the CNH. My immediate interpretation was that the CNH would appreciate against the USD, leading me to consider entering a short position on the USD/CNH pair.
Trade Entry
With the positive GDP data, I quickly analyzed the price action on my trading platform using a 15-minute timeframe. The USD/CNH pair had already begun to react to the news, but the USD was strengthening against the CNH, which I hadn’t expected.
I was still sure my analysis was correct, so I looked for an entry to take a short position. Once a 15-minute red candle closed after the initial spike in price, I decided to short the USD/CNH at 7.27595, placing a stop-loss order at 7.28305 to manage my risk in case the market moved against me.
Trade Exit
I monitored the trade closely throughout the morning. As the market continued to digest the GDP figures, the USD/CNH pair steadily declined, moving in my favor.
I set a target price of 7.26739, which I determined based on a 61.8% Fibonacci retracement level. In 30 minutes, the price reached my target, resulting in a profit of 85.6 pips.
Post-Trade Analysis
After closing my recent trade, I took a step back to analyze my performance and decision-making. This review included revisiting the GDP announcement, my initial interpretation of the data, and the technical signals that influenced my entry point.
My swift reaction to the stronger-than-expected GDP figures was a crucial factor in the USD/CNH trade’s success. Technical analysis provided valuable confirmation signals, further solidifying my confidence in the entry point. Setting clear stop-loss and target prices also played a vital role, as they helped manage risk and secure profits.
This trade experience highlighted the importance of staying informed about economic events and being prepared to act when opportunities arise. It also reinforced the value of combining fundamental analysis with technical indicators to make well-rounded trading decisions.
Bottom Line
Understanding the CNH and its influencing factors is crucial for day traders. Key influences include China’s economic indicators, PBoC policies, global market sentiment, trade relations, USD movements, capital flows, and government policies.
Monitoring these factors will help you anticipate CNH price movements and make informed trading decisions.
To get started, refer to our list of the best brokers with USD/CNH.
Article Sources
The writing and editorial team at DayTrading.com use credible sources to support their work. These include government agencies, white papers, research institutes, and engagement with industry professionals. Content is written free from bias and is fact-checked where appropriate. Learn more about why you can trust DayTrading.com