How To Build A Balanced Portfolio


All asset classes will experience 50-80 percent (or larger) drawdowns over the course of one’s lifetime.
This illustrates the importance of having a balanced portfolio, or one that avoids systematic biases where a portfolio will naturally do well in a particular environment and poorly in others.
In this article, we’ll cover how to build a balanced portfolio and provide various examples of what a balanced portfolio asset allocation looks like.
The basic idea behind a balanced portfolio
The central idea behind a balanced portfolio is how to design an asset management program that gains an efficient strategic exposure to the global markets. This means an allocation that requires minimal forecasting or tactical bets on what the “correct” allocation should be.
Most people are biased toward their own domestic stock market in their portfolios. They typically think of diversification within the narrow scope of selecting different securities in a single asset class (e.g., owning common stock in different companies) or sprinkling in bonds and cash for a small portion.
The issue is that each asset class as a whole has its own environmental bias.
When growth takes a turn for the worse relative to what’s been priced in, stocks can easily lose a year’s worth (or more) of accumulated gains in just a few days.
Due to this environmental bias, stock-heavy portfolios suffer horrendous drawdowns.
Moreover, cash and bonds yielding zero makes balance and diversification more important than normal. Those assets can no longer offset a drop in the cash flows of equities.
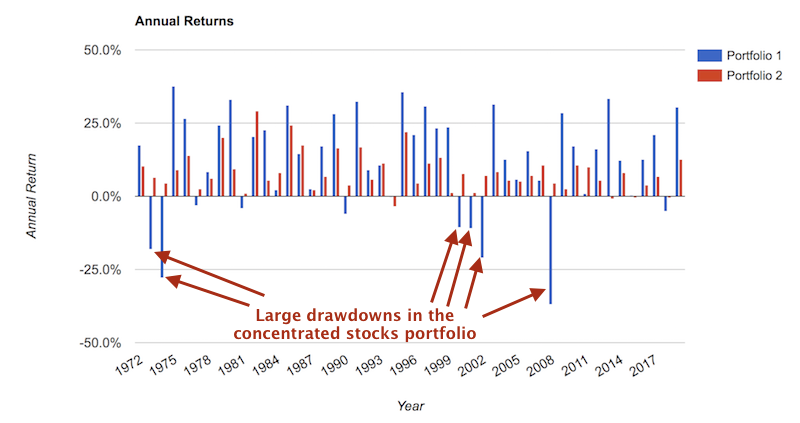
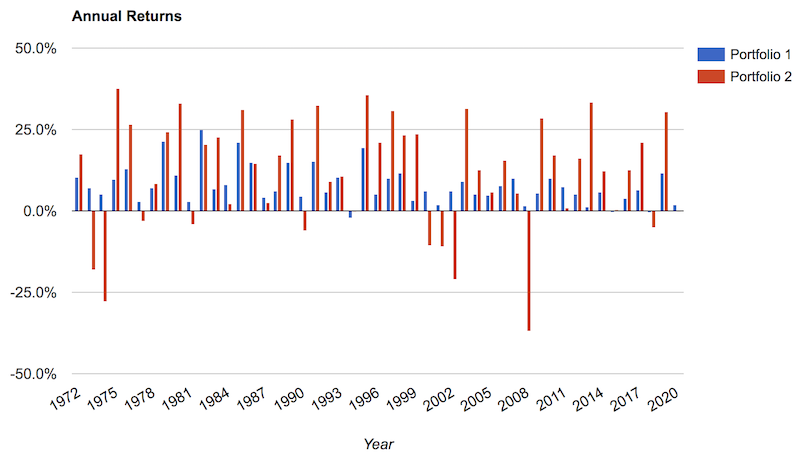
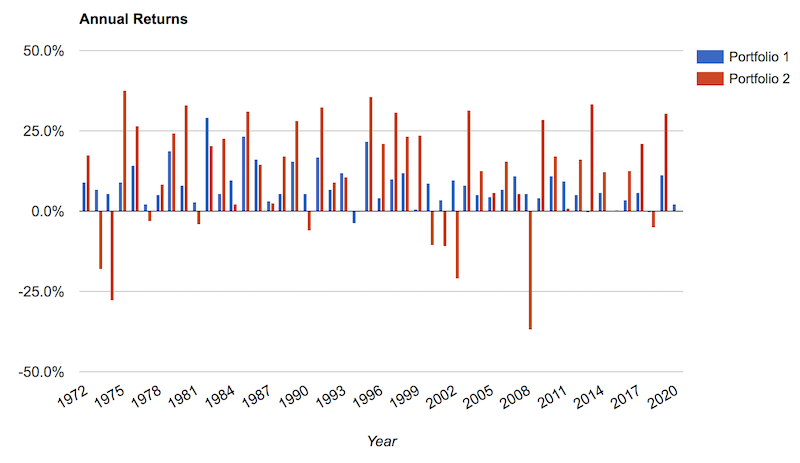
This can be seen below comparing the year-on-year returns of an “all stocks” portfolio versus a more balanced allocation, which has rarely has down years and goes through small drawdowns and short underwater periods. (What this balanced portfolio allocation is and how to build a balanced portfolio we’ll get into further down.)
Financial assets are securitizations of cash flows on goods and services. Asset classes are priced based on what an investor would pay, as a lump sum payment, for said future cash flows.
The biggest determinate of what makes an asset class move is when the expectation of that income stream changes.
Strategic diversification that performs well throughout the market cycle is achieved through a balance among asset classes whose fundamentals are best suited to different parts of the economic cycle.
The two main macroeconomic factors that influence asset prices are growth and inflation. The trending moves in growth and inflation being above or below expectations is typically what drives trending up and down moves in certain asset classes.
Therefore, shifts in these variables relative to expectations are fundamentally what drives their movements at the very high level – i.e., rising or falling growth and rising or falling inflation.
- (i) Rising growth is good for equities, corporate credit, emerging market sovereign debt and EM currencies.
- (ii) Falling growth is good for reserve-currency sovereign bonds (both nominal and inflation-linked) and the safest forms of corporate credit.
- (iii) Rising inflation is good for inflation-linked bonds, some emerging market assets, and commodities.
- (iv) Falling inflation is good for nominal sovereign and corporate bonds and equities.
Having cash on hand is useful for when money and credit are tight and financial assets underperform cash (e.g., 1982, 1994, latter part of 2018).
The counterargument against strategic diversification is commonly:
- “Why not just take the risk of going ‘all in’ on equities? They have the highest return. The drawdowns are just part of what goes into it.” Or:
- “Stocks always go up.”
Regarding the first argument, it’s not necessary to go “all in” on a certain asset class when you can diversify among different asset classes and mix them well to produce a more optimized portfolio that can give you the same return for less risk, more return for the same risk, or some combination thereof.
When a portfolio has environmental bias, your expected distribution of outcomes is much wider.
Having a balanced portfolio allocation is a form of risk management and you can do this in a way that won’t constrain your long-run returns. (This is the most common knock against diversification.)
Everybody’s favorite asset class – whether that’s stocks, bonds, gold, oil, and so on – is going to drawdown more than 50 percent during their lifetime.
Diversifying within asset classes can help reduce drawdowns.
For example, if you are concentrated in tech stocks or energy stocks, you can expect your risk and drawdowns to be worse than having a balanced allocation of equities that has exposure to different “factors” (value, growth, dividends, momentum, size, quality, and so on).
If you had invested in the NASDAQ during the top of the 2000 bubble, you would have lost over 80 percent and been underwater for 15 years. And most investors have a lot of trouble hanging on to investments due to emotions, or suffer the need to raise cash when portfolios erode their collateral cushion, and so on.
In bonds, you have your choice among corporate bonds, safe government bonds, high-yield bonds, different durations, different geographies, and so forth.
Commodities can be thought of as a growth-sensitive asset class and as alternative currencies, and each commodity market is subject to its own supply and demand considerations.
As mentioned, what you can be pretty sure of is that each asset class will act differently. When some assets zig, others zag.
In other words, all asset classes have environments in which they do well and others in which they do poorly.
Consequently, owning the standard portfolio that’s full of equities is equal to taking a large bet that growth will be above the dollar-weighted expectation.
Regarding the second argument, stocks do not always go up, even when thinking out over decades. Stock prices are a function of future earnings discounted back to the present.
So, broadly you need two things to go your way (not necessarily both):
- (i) earnings to go up through higher sales and/or margin expansion, or
- (ii) lower interest rates to increase the present value of cash flows
Bias is a key account killer
There’s a host of reasons why traders get wiped out – e.g., uneducated use of leverage, betting too much on a certain thing, impatience, and the whole subject of risk management gone wrong in its various ways.
But bias is one of the biggest reasons why traders blow huge holes in their account (or worse).
Most traders approach the markets with certain preconceived biases, whether its explicit – namely, having certain opinions over what’s going to happen – or implicit (i.e., being skewed toward an equity-heavy allocation as the default).
These biases result in traders holding positions for no other reason that they already own them or believing that exiting them is akin to “giving up” (i.e., a type of status quo bias). This results in making trading decisions that are not based on reality.
The basis behind building a balanced portfolio
The key to having a balanced portfolio allocation is about balancing the risk among different assets.
Stocks are 2x-3x more volatile than bonds.
With the standard 60/40 stocks/bonds portfolio, this is anything but a balanced portfolio because stocks will dominate the movement. Namely, stocks contribute disproportionately to such a portfolio’s risk. It’s actually closer to an 89/11 portfolio in that respect.
A 50/50 stocks/bonds portfolio is closer to a 77/23 even though it’s ostensibly balanced because the dollar amounts are equal.
Moreover, because bonds yield less than stocks, your long-run returns will be lower if you’re trying to equate your risk between the two to achieve balance.
To achieve risk parity between stocks and bonds you’re at something closer to a 30/70 or 35/65 allocation. The problem, of course, is the paltry returns that would result from such a portfolio.
That’s why bringing parity between the risk of stocks and the risk of bonds is essential to have an efficient strategic asset allocation.
The key behind a balanced portfolio allocation
Once you have taken the steps to make all asset classes exhibit approximately the same risk, you can begin to diversify for all economic environments without having to forfeit expected returns.
Or, to put it a different way, your search for diversification will no longer need to be constrained by its impact on your long-term returns.
Once bonds are leveraged to match the risk of equities or whatever level of risk you want (e.g., normally this is done through the bond futures market or another leverage technique) one can match the risk contribution of equities or any other asset class without fear of giving up returns.
In other words, in order to achieve balance, the idea is not to excessively diversify away the “growth” part of the portfolio by cutting down its notional allocation, but rather leveraging the fixed-income portion to match the growth portion.
By extension, this type of portfolio will achieve higher return per each unit of risk while also greatly diminishing left-tail risk.
The graph below shows a representation of how various asset classes come as they are in terms of return versus their risk. Different investors will have different expectations relative to what is shown below.
But the general point is that investors want to be compensated for taking on more risk. Any graph plotting risk and return will naturally see a general trend going from the lower left to upper right.
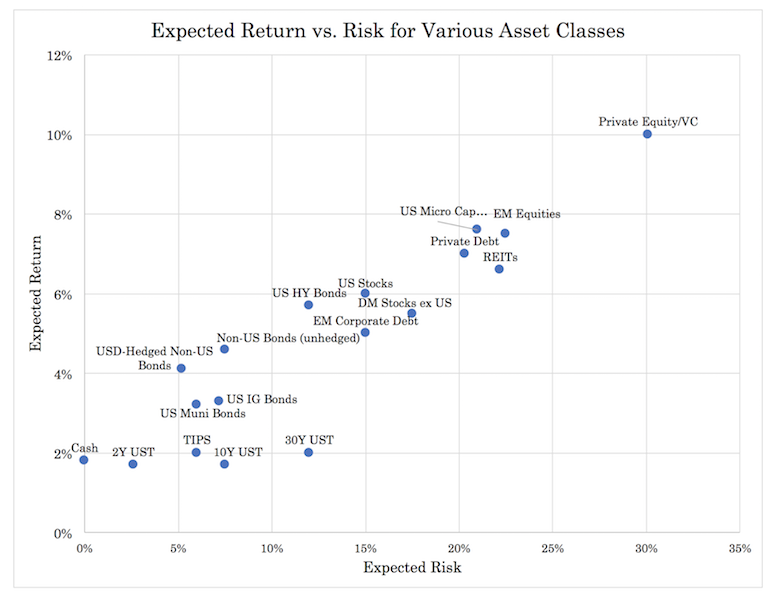
Now if someone wanted to design a portfolio that generated them an expected 12 percent returns per year, they would look at this chart and see that it’s impossible unless they employ leverage.
Moreover, they’d be inclined to buy things toward the upper right of the chart, particularly equities, which are already inherently leveraged (companies have debt). So, they’d have a ton of risk in only one or two asset classes that are relatively correlated to each other.
If they didn’t want that level of risk, they’d have to buy more assets toward the lower left, which would decrease their risk but at the cost of expected returns.
If we wanted to combine these asset classes into a diversified portfolio each returning 12 percent, the trader would need to employ leverage or similar leverage-like techniques to deliver higher-returning and higher-risk assets necessary to achieve this objective.
They could then be balanced in a way to construct a portfolio yielding the higher return but at substantially less risk if they leveraged only a very limited number of asset classes. Or at lower risk but at a comparable return to equities or their desired benchmark.
A stylized example of this process of leveraging up each asset class and blending them into an optimally structured portfolio is shown below.
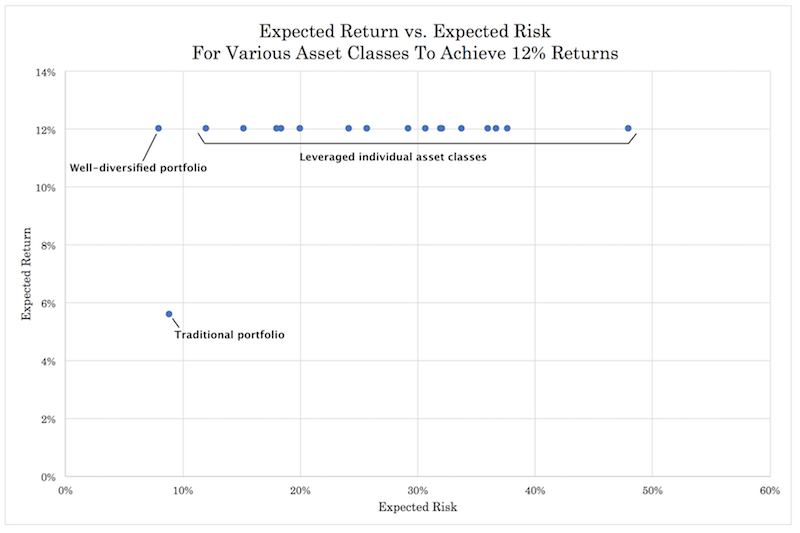
This shows the general idea that all asset compete with each other because they can be leveraged to yield the same returns. However, given different asset classes perform differently in different environments, their correlations are different.
That means you’ll still get the 12 percent (or whatever return) but blending them well will allow you to cut down on your risk.
Done well by diversifying across asset classes, you should be able to improve you risk versus your reward (relative to investing in just one asset class) by a factor of about 3-to-1.
Diversifying well across geographies and across currencies can help improve that a bit further.
For the math on diversification, we covered that in a separate article.
Beyond the 60/40 and standard ‘diversified’ portfolios
Balancing your portfolio between the competing forces of growth and inflation requires more than just stocks and bonds.
It is fairly straightforward to balance your portfolio to growth using just equities and bonds, but it is hard to have a balanced portfolio allocation using just those two asset classes.
This is because they are both dependent on low interest rates to keep their prices healthy.
If inflation flares up, this increases interest rates unless they are artificially pegged low. (In which case, the effect will be felt through the currency.)
The drop in the price of bonds will depend on duration and credit risk. Higher inflation also brings the prospect of tighter monetary policy. In such environments, you will tend to see both stocks and bonds perform poorly and things like commodities, precious metals, and cash (as a capital preservation tool) do well.
The US was in this type of inflationary environment in the 1970s. The traditional 60/40 portfolio underperformed. One that was more balanced and had a bit of gold in the portfolio did much better.
Portfolio Allocations
| Asset Class | % |
|---|---|
| US Stocks | 30% |
| 10-yr Treasury | 60% |
| Gold | 10% |
| Asset Class | % |
|---|---|
| US Stocks | 60% |
| 10-yr Treasury | 40% |
Portfolio Returns
| Portfolio | Initial Balance | Final Balance | CAGR | Stdev | Best Year | Worst Year | Max. Drawdown | Sharpe Ratio | ||
|---|---|---|---|---|---|---|---|---|---|---|
| Balanced | $10,000 | $634,639 | 8.93% | 7.27% | 31.39% | -4.58% | -11.94% | 0.58 | ||
| US 60/40 | $10,000 | $835,204 | 9.55% | 9.94% | 31.69% | -15.07% | -28.54% | 0.50 |
Returns of the balanced portfolio are steadier over time and the drawdowns are not as severe:
Example Balanced Portfolio Allocation
Take the following example of a more balanced allocation:
| Asset Class | % |
|---|---|
| US Stocks | 20% |
| 10-yr Treasury | 20% |
| Gold | 10% |
| Cash | 20% |
| Intermediate Treasury | 30% |
We can diversify further by using different currencies, branching into corporate bonds, municipal bonds, and so on. But to prevent the allocation from getting overly complicated, we’re keeping it to five different broad asset classes.
Compare this to a 100% stocks portfolio:
| Asset Class | % |
|---|---|
| US Stocks | 100% |
Portfolio Returns
| Portfolio | Initial Balance | Final Balance | CAGR | Stdev | Best Year | Worst Year | Max. Drawdown | Sharpe Ratio | ||
|---|---|---|---|---|---|---|---|---|---|---|
| Portfolio 1 | $10,000 | $406,188 | 7.94% | 5.24% | 25.14% | -2.15% | -7.99% | 0.61 | ||
| Portfolio 2 | $10,000 | $1,135,926 | 10.25% | 15.58% | 37.82% | -37.04% | -50.89% | 0.41 |
If the balanced portfolio allocation was leveraged to match the volatility of the “all stocks” allocation, the compounded annualized growth return (CAGR) would be 14.0 percent (versus 10.4 percent for all stocks), with a maximum drawdown of 23.3 percent, versus 50.9 percent for all stocks. (This takes into account the 4.75 percent borrowing rate on cash.)
Measures of return relative to the risk taken on are also superior, and does so at a lower correlation to the market.
The red bars, showing annual equity returns, show the clear environmental bias (and consequent large drawdowns) associated with stock-heavy portfolios.
The role of leverage in building a balanced portfolio
As mentioned, to get asset classes to exhibit the same risk such that you can effectively diversify among all environments, this will involve using leverage in some form. This is fundamentally how a bond can compete with a stock, a piece of real estate, and so forth.
Leverage, when used appropriately as a tool to better accomplish your objectives, can actually lower your risk and/or increase your return to risk ratio.
As mentioned, when designing a balanced portfolio, to get the fixed income volatility in line with that of equities, this is typically achieved through bond futures. This gets you greater access to bonds, with low collateral outlay, to help you balance out your exposure to stocks.
The cash flows of stocks are theoretically perpetual, whereas the cash flows of bonds typically have a fixed end date (i.e., when the bond matures). This is the reason why stocks are generally more volatile overall – they have longer duration.
Moreover, in the case of a theoretical bankruptcy, creditors (i.e., bondholders), will be paid before shareholders because they are more senior in the capital structure. So there’s a credit-related risk aspect as well.
Nonetheless, duration is taken as the key determinant of risk premiums.
(The basic concept behind duration is, theoretically, if you invested a lump sum, how long would it take you to earn your money back without touching the principal? The longer it takes, the longer the duration.)
Under the duration argument, this means that pricing across asset classes would share a common delta.
By extension, one could expect that the volatility regimes among different asset classes to remain relatively proportionate throughout time.
Also by extension, if the volatility among asset classes remains relatively correlated throughout time, this removes the large risk associated with introducing leverage into a portfolio.
To balance stocks and bonds in a portfolio, you would need to leverage the bond portion to match the volatility of stocks.
This is done either by borrowing cash and putting it into bonds, or through the leverage technique where you put forward a small bit of collateral for larger exposure to the asset class.
If the volatility of bonds increased by a much greater proportion than stocks over a significant period, this adds risk unless volatility spikes relative proportionally across all included asset classes.
Empirically, changes in the volatilities among different asset classes share a materially positive correlation.
Fundamentally, this is because the same set of economic, sentiment, and behavioral factors driving markets has an influence on all of them.
For example, in 2008, the markets went from discounting a higher level of growth in the future to a lower level, which was negative for equities but that same influence flowed into bonds as well, which drove the safest forms of credit (e.g., US Treasuries) higher.
The drop in real interest rates also drove forward gold prices, which central banks use as a reserve and institutional investors use as a currency hedge when real interest rates become unacceptably low.
Because this correlation in volatility regimes holds up relatively well, this is good for balanced portfolios because the benefits from the diversification effect are maintained.
Bonds and their role in a balanced portfolio
Nominal rate bonds have traditionally been a material part of the balanced portfolio allocation. Sometimes the balanced beta concept even becomes misconstrued as “adding a lot of bonds”.
However, it’s important to understand that a balanced approach to constructing a portfolio is not about any particular asset allocation, nor has it ever been dependent on any particular asset class.
While the overarching goal remains the same – to effectively extract risk premiums without having a bias toward higher or lower growth or inflation – the way you construct a portfolio to achieve this goal may change over time.
The risks and returns of asset classes, currencies, and countries will change over time. Simplified portfolio approaches can work as well and get most of the benefits. But it’s not imperative to have allocations toward any particular asset class in any particular way.
With the circumstances we’ve mentioned in other articles, such as very low rates of forward returns on cash and bonds, nominal rate bonds are no longer as big a part of that.
Since most traders and investors are already biased to hold a lot of equities, balance traditionally involves diversifying the equities part.
That often means traditional nominal rate bonds can be a material part of the allocation, but it can be other things as well, especially in a world where bond yields are at around zero in all the main reserve currencies.
Protection toward all that risk is more likely going to come from other assets and asset classes.
This can include assets like gold, inflation-linked bonds, assets in different geographies and currencies, and certain types of stocks and private assets.
Nominal rate bonds will still remain a piece of the balanced portfolio approach, especially in the parts of the world where nominal yields are still positive and normal.
When they have positive yields in countries and currencies you might want to have some exposure to, that can make perfectly good sense. Many Eastern countries have a normal short-term interest rate (cash), positive bonds yields, and a regular upward-sloping yield curve.
Investors tend to get fixated into an approach that strongly biases them to their domestic markets. It’s a natural tendency to stick to what they know of and have access to.
For a US-based trader, for example, that usually means holding all of their portfolio (or most of it) in stocks (usually all held long), all US companies, and all in US dollars.
That will work well in a certain environment that favorable to US equities. You’ll get the big up-moves in some environments and have terrible losses in others where the discounted environment is inhospitable to good returns for equities.
It goes for all asset classes, no matter what it is. Bonds, gold, oil, and so on will all do well in certain environments and badly in others. And knowing when these expectations will shift is not easy, even for the most sophisticated institutions.
Such concentrated approaches are heavily biased toward a particular type of environment that won’t be able to take advantage of the reality that capital and wealth mostly shifts around rather than being destroyed.
For example, when stocks decline, the money that “disappeared” wasn’t actually destroyed (at least not the vast bulk of it). It simply shifted into other asset classes, other countries, other currencies, and different stores of wealth.
US stocks are just a sliver of the available universe of investments and all assets compete with each other.
As part of a balanced allocation, nominal rate bonds will be less of a part of it provided where the yields on them are in all the main reserve currencies. They’ll still be there, just less of a piece of it.
How to Build a Balanced Portfolio on Your Own
Broadly speaking, among liquid asset classes, you have your choice among the following:
- Stocks
- Bonds and various forms of fixed income (nominal and inflation-linked varieties)
- Commodities
- Gold (considered on its own, as it fits better as a currency rather than a traditional commodity subject to supply and demand forces based on its consumption)
The “growth” part of your portfolio is mostly going to be in the stocks portion. Right now, in developed markets, fixed income doesn’t generate you much yield in either nominal or real terms.
If you use bond futures, your expected return is virtually nil, as it’s not a coupon-bearing instrument. It simply tracks the direction of the underlying. Your yield can come in the form of the “roll yield” – buying a cheaper contract as you “roll” the contract from one maturity to the next, usually quarterly.
Let’s say you built a portfolio via futures that came out to the following allocations:
- Stocks: 16%
- Short-term Treasury bonds: 47%
- Intermediate-term Treasury bonds: 14%
- 10-year Treasury: 14%
- Gold: 5%
- Commodities: 4%
Expected Performance
Expected performance can be assessed through backtesting.
However, for various reasons, we do not expect future returns to be like past returns. So backtesting can be misleading for reasons related to the idea that the past is not always like the future.
Investors underestimated the 2008 crisis because such a debt dynamic had never occurred during their lifetimes.
Backtesting is useful, but other forms of stress tests should also be run.
If we backtest the above in Portfolio Visualizer, we get the following results compared alongside an all stocks portfolio. Commodities are only part of the data since January 2007, so we have a limited sample:
Portfolio Allocations
| Asset Class | % |
|---|---|
| US Stock Market | 16% |
| 10-year Treasury | 14% |
| Gold | 5% |
| Short Term Treasury | 47% |
| Intermediate Term Treasury | 14% |
| Commodities | 4% |
| Asset Class | Allocation |
|---|---|
| US Stock Market | 100% |
Portfolio Returns
| Portfolio | Initial Balance | Final Balance | CAGR | Stdev | Best Year | Worst Year | Max. Drawdown | Sharpe Ratio | ||
|---|---|---|---|---|---|---|---|---|---|---|
| Balanced | $10,000 | $17,526 | 4.24% | 3.49% | 10.23% | -1.27% | -6.55% | 0.96 | ||
| Stocks | $10,000 | $28,761 | 8.14% | 15.91% | 33.35% | -37.04% | -50.89% | 0.52 |
We can see that our return to risk metrics (Sharpe, Sortino) are superior. We only get about half the return, but at just 23 percent of the risk.
Our maximum drawdown was 6.55 percent. If we multiply that by our notional exposure of $922k, that comes to about a $60k loss. Naturally, we should expect to have at least that amount on hand to be able to cover our drawdown.
However, if we do backtest this allocation by lumping the commodities allocation into gold, we can get results all the way back to 1972:
Portfolio Allocations
| Asset Class | % |
|---|---|
| US Stock Market | 16% |
| 10-year Treasury | 14% |
| Gold | 9% |
| Cash | 47% |
| Intermediate Term Treasury | 14% |
| Asset Class | % |
|---|---|
| US Stock Market | 100% |
Portfolio Returns
| Portfolio | Initial Balance | Final Balance | CAGR | Stdev | Best Year | Worst Year | Max. Drawdown | Sharpe Ratio | ||
|---|---|---|---|---|---|---|---|---|---|---|
| Balanced | $10,000 | $275,625 | 7.08% | 3.88% | 21.21% | -0.52% | -6.29% | 0.60 | ||
| Stocks | $10,000 | $1,135,926 | 10.25% | 15.58% | 37.82% | -37.04% | -50.89% | 0.41 |
Here we continue to see much better risk metrics in terms of worst year, maximum drawdown, and super reward to risk metrics to go along with lower market correlation.
Our maximum loss since 1977 has been 7.55 percent. If we call this 8 percent, that means our cash cushion would need to be at least $74k (.08 multiplied by the $922k notional).
What would happen if we were to lump our ZT futures into the “intermediate Treasuries” bucket?
We get the following (and also allows us to test back to 1972):
Portfolio Allocations
| Asset Class | % |
|---|---|
| US Stock Market | 16% |
| 10-year Treasury | 14% |
| Gold | 9% |
| Intermediate Term Treasury | 61% |
| Asset Class | % |
|---|---|
| US Stock Market | 100% |
Portfolio Returns
| Portfolio | Initial Balance | Final Balance | CAGR | Stdev | Best Year | Worst Year | Max. Drawdown | Sharpe Ratio | ||
|---|---|---|---|---|---|---|---|---|---|---|
| Balanced | $10,000 | $449,337 | 8.16% | 5.82% | 29.16% | -3.87% | -9.05% | 0.59 | ||
| Stocks | $10,000 | $1,135,926 | 10.25% | 15.58% | 37.82% | -37.04% | -50.89% | 0.41 |
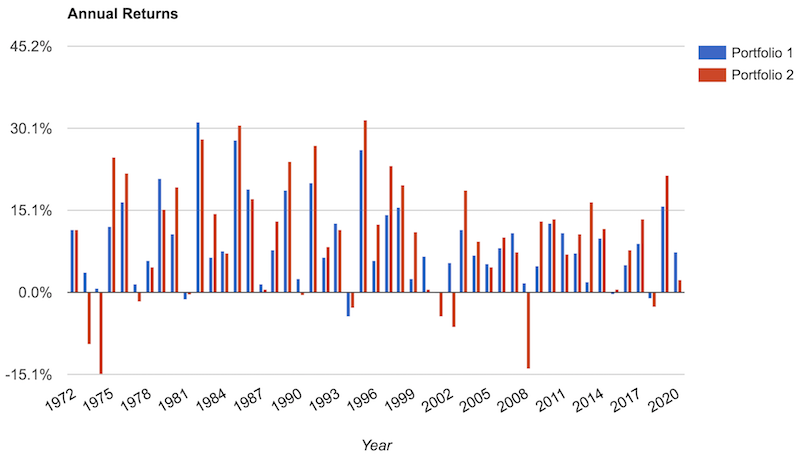
Annual returns:
Drawdowns, as can be observed below, are kept well under control. Limiting losses is a very important consideration because it carries with it material compounding effects over the long-run.
The more you drawdown, the harder it is to climb back out of the hole. If your drawdown is bad enough, it’s almost impossible to recover from it and would essentially require a recapitalization, or essentially starting all over again.
Drawdowns of any material size need to be avoided at all costs.
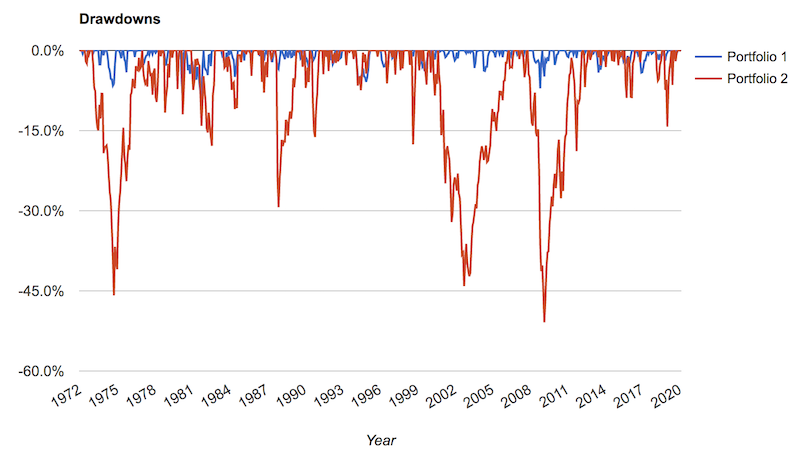
Our maximum drawdown over this time was about 9 percent. This means we’d need to have at least $85k, based on nearly 50 years’ worth of data, to be confident enough to withstand a drawdown.
A better way to stress test
Backtesting can be faulty because it uses historical returns.
When future returns will be lower, this will cause future maximum drawdowns to be underestimated.
For reasons covered in other articles, asset classes have the same risks but lower returns relative to what they’ve had in the past. That means your drawdowns going forward will be disproportionate to your annual gains relative to the past.
To get a forecast of what future maximum drawdowns are likely to be, we can use a Monte Carlo simulation.
Monte Carlo is a type of simulation method for risk analysis that is applicable to a host of different real-world applications. You can either run this in mathematical software like R Studio, or use an online template.
Portfolio Visualizer has a Monte Carlo simulation feature built into it and has easy-to-read, interactive graphics, and a host of supplementary data. It’s convenient if you don’t have your own internal models set up.
This allows us to input a starting capital amount, percent allocation, forecasted returns, number of years to simulate, input correlations and volatility, what inflation is likely to approximate (and its volatility), and some other bells and whistles (like how much to contribute and withdraw at regular intervals).
In this case, we’ll forecast returns out 75 years, use historical volatility (a good assumption if their duration hasn’t changed much), and use inflation at 2 percent with plus/minus-2 percent annual volatility.
We can also change up the allocation to a broader set of asset classes because we don’t have to worry about a dataset not going back far enough, as might be the case with backtesting. For example, instead of having all of the stocks allocation in US equities, we can split some of it into emerging markets, which will deliver higher returns over the long-run.
What do we use for expected returns?
But using the yield of the underlying bonds minus the current cash rate will give you a good proxy. As of right now, this is about 0 percent for most maturities (and a bit higher for durations above 15 years, though is constantly changing).
Your bond futures will heavily act as a hedge, not a yield-bearing type of investment.
Gold is in the same boat. Over the long-term it yields a little bit better than the rate on cash. But gold is a structurally contango market, which means your roll yield is negative – i.e., you will consistently need to buy a more expensive contract as you roll you position forward.
Right now, that’s by a bit more than 2 percent per year. Or about the rate on USD cash plus a small premium. Therefore, using gold futures (e.g., GC or MGC on NYMEX), your net return is expected to be about zero.
If you use cash bonds or physical gold (assuming no storage cost, insurance, and so on), you will see some yield, but futures contracts naturally involve low collateral outlays for a lot of exposure.
Here is ultimately what we entered in terms of the allocations among different asset classes:
Portfolio Allocation
| Asset Class | % |
|---|---|
| US Stock Market | 13% |
| 10-year Treasury | 11% |
| Gold | 13% |
| Short Term Treasury | 36% |
| Intermediate Term Treasury | 11% |
| Commodities | 3% |
| Emerging Markets | 13% |
Simulated out 50 years:
Summary Statistics
| 10th %ile | 25th %ile | 50th %ile | 75th %ile | 90th %ile | |
|---|---|---|---|---|---|
| Time Weighted Rate of Return (nominal) | 0.76% | 1.32% | 1.92% | 2.50% | 3.05% |
| Time Weighted Rate of Return (real) | -1.10% | -0.56% | 0.02% | 0.61% | 1.15% |
| Maximum Drawdown | -33.57% | -28.00% | -22.81% | -18.84% | -16.10% |
| Safe Withdrawal Rate | 1.43% | 1.68% | 2.00% | 2.36% | 2.74% |
| Perpetual Withdrawal Rate | 0.00% | 0.00% | 0.03% | 0.61% | 1.14% |
Expected Annual Return
| Percentile | 1 Year | 3 Years | 5 Years | 10 Years | 15 Years | 20 Years | 25 Years | 30 Years | 40 Years | 50 Years |
|---|---|---|---|---|---|---|---|---|---|---|
| 10th Percentile | -3.93% | -0.55% | 0.74% | 1.97% | 2.50% | 2.79% | 3.00% | 3.15% | 3.40% | 3.58% |
| 25th Percentile | -1.39% | 2.01% | 2.68% | 3.36% | 3.59% | 3.75% | 3.88% | 3.97% | 4.08% | 4.18% |
| 50th Percentile | 5.07% | 4.88% | 4.86% | 4.87% | 4.85% | 4.84% | 4.84% | 4.86% | 4.85% | 4.85% |
| 75th Percentile | 11.32% | 7.82% | 7.04% | 6.39% | 6.10% | 5.95% | 5.84% | 5.75% | 5.62% | 5.54% |
| 90th Percentile | 15.76% | 10.31% | 9.08% | 7.81% | 7.26% | 6.96% | 6.74% | 6.58% | 6.33% | 6.18% |
Annual Return Probabilities
| Return | 1 Yr | 3 Yrs | 5 Yrs | 10 Yrs | 15 Yrs | 20 Yrs | 25 Yrs | 30 Yrs | 40 Yrs | 50 Yrs |
|---|---|---|---|---|---|---|---|---|---|---|
| > 0.0% | 68.57% | 88.07% | 93.90% | 98.71% | 99.60% | 99.89% | 99.97% | 100.00% | 100.00% | 100.00% |
| > 2.5% | 61.50% | 70.34% | 76.60% | 85.46% | 89.98% | 92.76% | 94.92% | 96.24% | 98.19% | 99.12% |
| > 5.0% | 53.60% | 48.82% | 48.18% | 47.79% | 46.90% | 46.39% | 45.61% | 45.39% | 44.83% | 44.42% |
| > 7.5% | 38.07% | 28.83% | 21.14% | 12.36% | 7.92% | 5.50% | 3.58% | 2.36% | 1.21% | 0.57% |
| > 10.0% | 30.59% | 11.92% | 5.98% | 1.19% | 0.28% | 0.09% | 0.03% | 0.00% | 0.00% | 0.00% |
| > 12.5% | 15.42% | 3.71% | 0.79% | 0.02% | 0.00% | 0.00% | 0.00% | 0.00% | 0.00% | 0.00% |
If we include the return generated on cash, our odds of making money in any given year is about 61 percent each year and 75 percent over five years.
How to Build a Balanced Portfolio: Step by Step
#1 Identify what your strategic asset allocation mix is going to be
Namely, how can you get to a “neutral” position such that your volatile “growth” portion (dependent on a good environment) can offset the portion dedicated to capital preservation (that does well in a disinflationary environment where growth runs below expectation)?
How can you get asset classes to exhibit the same risk so that you can diversify for all economic environments without the traditional conundrum of having to forgo returns?
#2 Based on that mix, what type of returns are you likely to get?
If your returns don’t look adequate, how can you make adjustments that gives you more upside without taking on unacceptable downside?
Can you improve your reward relative to your risk?
If you can improve your reward to risk ratio, do you have enough on hand to cover your potential loss?
#3 What type of drawdowns can you expect based on this mix?
Based on this, how much cash collateral do you need to have to ensure that you can always cover any drawdown? What will you put this cash buffer into – Treasury bills, inflation-protected government securities, a mix of safe government bonds and quality corporate credit?
Whatever you put this cash cushion into, make sure your duration is low to avoid wild swings and that the credit quality is high.
You could just let it sit idle as a cash balance, but your return is likely to be poor.
Cash and liquidity also provides options. When a part of your portfolio does poorly, this gives you the opportunity to pick up quality deals. But don’t go on too much of a spree. You always need enough of a cushion to cover your potential downside. If you don’t, you will probably eventually have a problem.
Bonds as diversification instruments going forward
Over the past several decades, traders and investors have become accustomed to bonds gaining when stocks slide. Bonds provided a type of offset to make the downswings in equities not as painful.
But now with interest rates low and with inflation volatility higher than normal (causing bonds and stocks to no longer reliably be negatively correlated), that kind of dynamic is no longer likely.
Not only do nominal bonds generate little income, but they no longer have the diversification potential.
Interest rates can only be pushed so low (in nominal terms) before it fails to stimulate new borrowing and lending activity.
This is why more investors are likely going to probably want to shift more of their allocation into inflation-protected fixed income securities.
Unlike nominal yields, return yields have no limit to how low they can go.
Nominal rates below zero can work to a degree. But after a while it’s not going to do much to stimulate more credit creation. At a point, lenders don’t receive enough compensation.
On the other hand, the real yield is simply the nominal yield minus inflation.
For example, if nominal yields are zero but the inflation rate is six percent, that means real yields are minus-600bps. Yields move inversely to prices.
So, in this type of environment of zero nominal yields and potentially higher inflation, inflation-linked securities aren’t constrained by the zero lower bound (or the effective bound slightly below zero) like nominal bonds are.
Accordingly, they can become an increasingly important source of diversification and of how to build a balanced portfolio.
Final Thoughts
Tactical asset management is difficult for the average investor to pull off operating in a marketplace full of sophisticated players with their own information and analytical advantages.
It’s extremely hard for professional investors as well.
It is not a made-up statistic that 95 percent of professional investors can’t beat a representative index over enough time. Even with quality returns, there are trading costs (commissions, price spread, interest expense), taxes, fixed costs, and so on.
Adding alpha (deviating from beta-related returns) is a zero-sum game. To add alpha, if you win, somebody else must lose. It’s actually negative-sum given the mentioned expenses like spreads and transaction costs.
For this reason, making money in the markets jumping in and out of trades is difficult to do.
The way the average investor is very likely to win over the long-run – if they choose to do it themselves – is by having an asset management program that achieves an efficient, strategic exposure to the global markets that can operate without forecasting or tactical adjustments.
That means they will need to find the appropriate balance of assets that helps them achieve a “risk neutral” position.
Namely, a balanced portfolio allocation that’s not biased toward any particular environment. This means including things beyond equities, such as fixed income (nominal and inflation-linked), gold, commodities, and gets them access to different geographies and currencies.
Other thinking on having a balanced portfolio
Investing in a Zero Interest Rate Environment
The Future of Trading & Investing: A ‘Store of Wealth’ Perspective
Stagflation: How It Occurs And Building a ‘Stagflation Portfolio’
Balanced Beta: Efficiently Balancing Risk, Not Capital
Building a Balanced Portfolio with Options
4 Alternatives to Bonds (and Cash)
Building a Balanced Portfolio with VRP Overlay
Simple Portfolios: Improving Outcomes by Simplifying